The unfolding curve can be divided into three regions:
- Pre-transition region : it shows how y for the folded protein i.e. yF responds to the denaturant.
- Transition region : it shows how y varies as the unfolding takes place.
- Post-transition region : it shows how y for the unfolded protein i.e. yU responds to the denaturant.
The equilibrium constant, Keq for the reaction can be calculated as follows:
| 8.4 |
The free energy change, Δ∆G for the reaction can be calculated from equation 8.5:
| 8.5 |
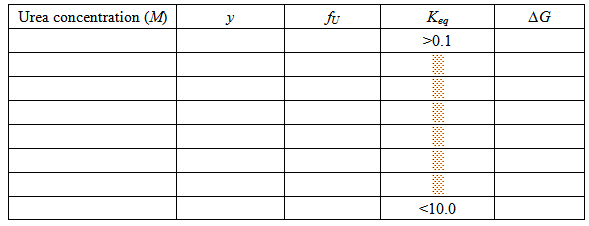
The values of Keq are most accurately measured near the midpoint of the denaturation curve and the errors become substantial for values outside the range 0.1 – 10. This corresponds to the ΔG values between –5.7 to +5.7 kJ/mole (~ ±1.36 kcal/mol ). The data for this range can be tabulated as shown in table 8.2.
Table 8.2: Analysis of the urea denaturation curve