Methods for following unfolding
Unfolding of a protein can be studied by a variety of methods. The techniques that are more routinely used include ultraviolet difference spectroscopy, fluorescence spectroscopy, and circular dichroism spectroscopy. Unfolding can also be monitored using NMR spectroscopy, measuring biological activity of the protein, viscosity, and optical rotatory dispersion. Fluorescence spectroscopy and circular dichroism spectroscopy are perhaps the two most commonly used methods for monitoring protein unfolding and we shall be discussing the unfolding experiment keeping these two techniques in mind. To decide upon the technique to be used, the spectra of both folded and unfolded proteins need to be recorded (Figure 8.1). Following spectral features are then considered for deciding upon the technique to be used:
- The magnitude of the response: At a given concentration of a protein, fluorescence intensity is usually much larger than the ellipticity. The sample amount may therefore be criteria for determining the method for monitoring unfolding. Furthermore, if the given protein lacks tyrosine and tryptophan residues, the fluorescence spectroscopy can simply not be employed.
- The difference in response for folded and unfolded protein: The fluorescence intensity of the folded protein in figure 8.1A, for example, is ~4-fold more than that of the unfolded protein at ~322 nm. In general, the wavelength where maximum difference is observed is used. The difference in magnitude may be largest at ~195 nm in far-UV circular dichroism spectra (Figure 8.1B), it is however convenient to monitor unfolding at 220 nm as oxygen absorbs very strongly below 200 nm.
- Signal to noise ratio: Apart from the difference in magnitude in the response, signal to noise ratio is an additional factor in determining the wavelength.
- Finally, fluorescence spectroscopy is not recommended for monitoring thermal denaturation as pre- and post-transition baselines are steep and sensitive to temperature.
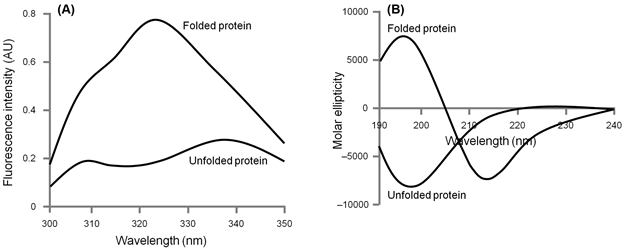
Figure 8.1: Fluorescence and circular dichroism spectra of a hypothetical protein in folded and unfolded state