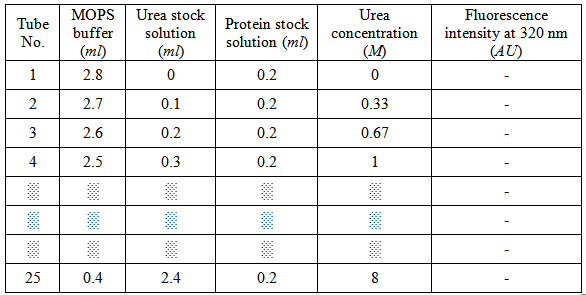
Observation table:
Table 8.1: Observation table for the protein unfolding using fluorescence spectroscopy
|
Analysis of unfolding curve
For a two-state unfolding process, plotting the fluorescence intensity gives a curve as shown in figure 8.2. A least square fitting is performed on the data to obtain a continuous curve.
For a two-state folding/unfolding mechanism, only folded and unfolded protein states are populated at significant concentrations at any of the urea concentration. Therefore,
| 8.1 |
where, fF and fU represent the fractions of the folded and unfolded proteins, respectively.
Thus the observed value of y (fluorescence intensity, in this case) at any point in the graph is given by:
| 8.2 |
where, yF and yU represent the values of y characteristic of the folded and unfolded protein states, respectively and can be calculated from the unfolding curve (figure 8.2).
Combining equations 8.1 and 8.2:
| 8.3 |