(f) Graphical data analysis techniques: Profile plots, vector plots and contour plots are few important techniques in which fluid flow properties can be analyzed. The profile plot (Fig. 3.1.2-a) indicates the variation of any scalar property (such as pressure, temperature and density) along some desired direction in a flow field. Using this plot, it is possible to examine the relative behavior of all variables in a multivariate data set.
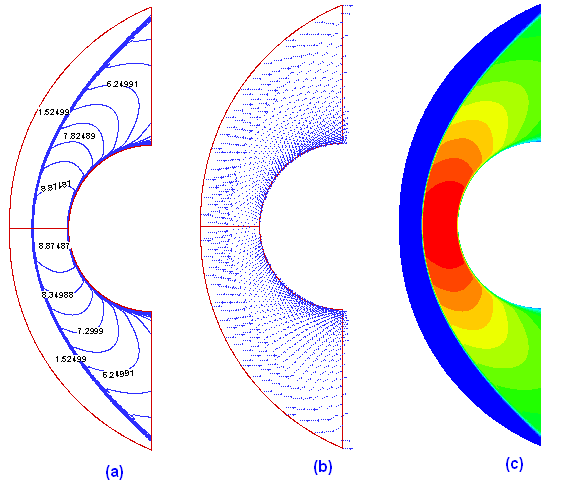
Fig. 3.1.2: Graphical representation of data analysis technique: (a) profile plot, (b) vector plot, (c) contour plot.
A vector plot (Fig. 3.1.2-b) is an array of arrows indicating the magnitude and direction of a vector property at an instant of time. Although, streamlines indicate the direction of instantaneous velocity field, but does not directly indicate the magnitude of velocity. A useful flow pattern for both experimental and computational fluid flow is the ‘vector plot' that indicates the magnitude and direction of instantaneous vector property.
A contour plot (Fig. 3.1.2-c) is a two-dimensional plot of a three-dimensional surface showing lines where the surface intersects planes of constant elevation. Thus, they are curves with constant values of scalar property (or magnitude of vector property) at an instant of time. They can be filled in with either colors or sheds of gray representing the magnitude of the property.