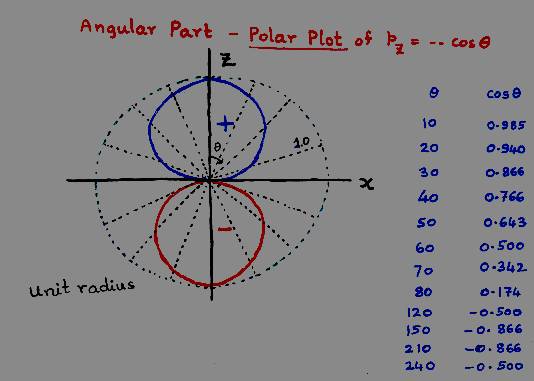
A very nice way of visualizing the angular parts of orbitals is through a polar plot. In a polar plot a circle of unit radius is drawn and from the center of the circle, several radii are drawn at various angles. The line vertically upwards is the  = 0 line. The horizontal line towards the right is the = 0 line. The horizontal line towards the right is the  = 90 0 = = 90 0 =  / 2 line. To plot the / 2 line. To plot the
 part of the orbital, the value of the normalized part of the orbital is marked on the radius corresponding to the particular value of part of the orbital, the value of the normalized part of the orbital is marked on the radius corresponding to the particular value of  . For example, the polar plot of cos . For example, the polar plot of cos is shown in fig 5.2 . For is shown in fig 5.2 . For  = 0, cos = 0, cos = 1 and the value of the function, 1, is at the tip of the radius at = 1 and the value of the function, 1, is at the tip of the radius at  = 0, touching the circumference of the circle. For = 0, touching the circumference of the circle. For  = =  / 4, cos / 4, cos  = 1/ = 1/  and the value of 0.707 is marked . For and the value of 0.707 is marked . For  = 90 0 , the value of zero is marked. For = 90 0 , the value of zero is marked. For  > >  / 2, cos / 2, cos  is negative and only the magnitudes of cos is negative and only the magnitudes of cos  are marked on the radii. When all these points are joined we get a figure close to the shape of the number 8 as shown in Fig. 5.2 are marked on the radii. When all these points are joined we get a figure close to the shape of the number 8 as shown in Fig. 5.2 |