Module 2 : Transmission Lines
Lecture 9  : Graphical Approach for Transmission Analysis
  The Smith Chart
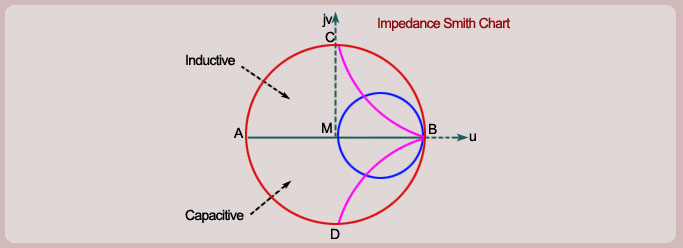
The Smith chart is a graphical figure which is obtained by superposing the constant resistance and the constant reactance circles within the unity circle in the complex -plane. Since we have mapped here the impedances to the -plane, let us call this Smith chart the Impedance Smith chart.
Generally the axes are not drawn on the Smith chart. However one should not forget that the Smith chart is a figure which is drawn on the complex -plane with its center as origin.
The intersection of constant resistance and constant reactance circles uniquely defines a complex load impedance on the -plane.
Let us identify some special points on the Smith Chart.
(a)
The left most point A on the smith chart corresponds to and therefore represents ideal short-circuit load.
(b)
The right most point B on the Smith chart corresponds to , and therefore represents ideal open circuit load.
(c) The center of the Smith chart M , corresponds to and hence represents the matched load.
(d)
Line AB represents pure resistive loads and the outermost circle passing through A and B represents pure reactive loads.
(e)
The upper most point C represents a pure inductive load of unity reactance and the lower most point D represents a pure capacitive load of unity reactance.
(f)
In general the upper half of the Impedance Smith Chart represents the complex inductive loads and the lower half represents the complex capacitive loads.
   
 
A ready made Smith Chart looks as in the following : Figure