By looking at the plots we can infer that as we will increase the time period more and more, we'll get more and more closely placed frequencies in the spectrum, i.e.: complex exponentials with closer and closer frequencies are required to represent the signal. Hence if we let T to approach infinity we'll get frequency infinitesimally close to each other. This is same as saying that we'll get every possible frequency and hence the whole continuous frequency axis. Thus our frequency spectrum will no more be a series , but will be a continuous function.
The representation will change from a summation over
discrete frequencies to an integration over the entire
frequency axis. The function, which (like the Fourier
Series coefficients) gives what is crudely the strength of each complex exponential in the representation is formally called the Fourier Transform of the signal. The representation takes the form:
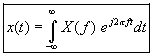
where X(f) is the Fourier Transform of x(t). Note the similarity of the above equation with the Fourier Series summation in light of the preceding discussion.
This equation is called the Inverse Fourier Transform equation,
x(t) being called the Inverse Fourier Transform of
X(f). Such a representation for an aperiodic signal exists, of course subject to some conditions, but we'll come to those a little later. |


