|
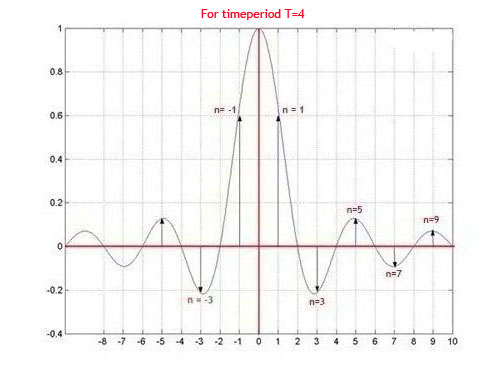
Say T1 = 1. For T = 4, the expression
 reduces to : reduces to : 
Now we know that every value of k in this equation gives us the coefficient corresponding to the  multiple of the fundamental frequency of the signal. Let's plot the Frequency Domain representation of the signal, which we shall also call the spectrum of the signal. Note the horizontal axis represents frequency, although the points marked indicate only scale. multiple of the fundamental frequency of the signal. Let's plot the Frequency Domain representation of the signal, which we shall also call the spectrum of the signal. Note the horizontal axis represents frequency, although the points marked indicate only scale.

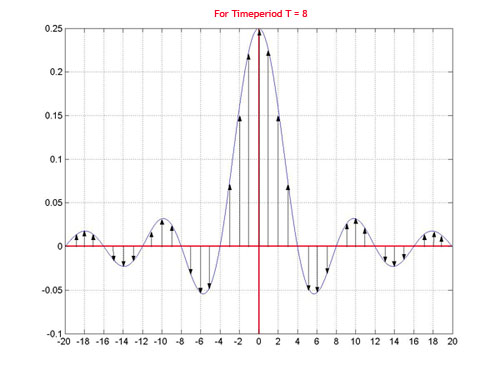
Now let's double the time period .the expression for the Fourier coefficients will become :

Since frequency is reciprocal of time period
 , ,
as the time period T increases, the distance between the consecutive frequencies f0 in the spectrum will reduce ,and we'll get the following plot.
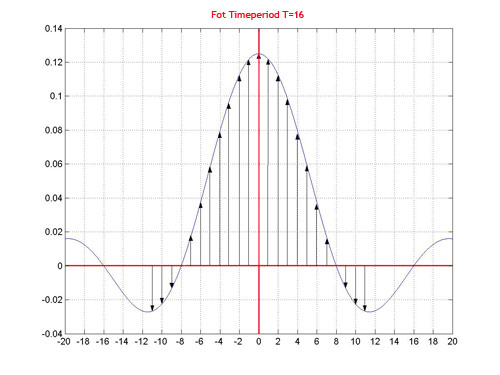
If we reduce the natural frequency by another half ( that is increase the time period by a factor of two ) , we'll get the following frequency spectrum :

|


