Differential scanning calorimetry:
Evaluation and interpretation of DSC curves:
Figure 22.02 shows the typical DSC curve for a sample exhibiting endotherm of melting at a particular heating rate.
The onset of melting (122.8°C) and peak temperature of melting (123.66°C) can be determined by extrapolation technique and peak values, respectively.
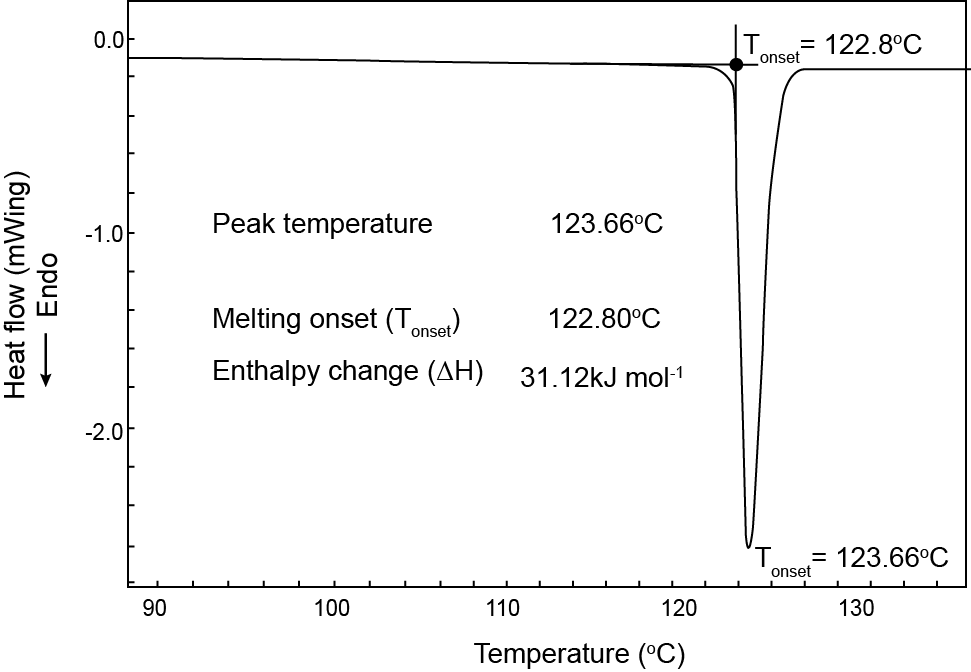
Figure 22.02: Typical DSC curve of a sample.
The enthalpy change can be calculated by integrating the area under the curve. The unit can be either J/g or J/mole depending on the nature of the sample.