![]() and
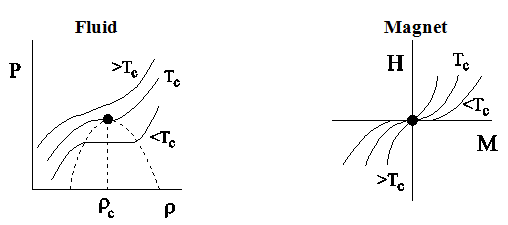
and ![]() diagrams: These phase diagrams shown in Fig.2.5. The most striking feature in this phase diagram is the change in shape of the isotherms as the critical point is approached. At high temperature
diagrams: These phase diagrams shown in Fig.2.5. The most striking feature in this phase diagram is the change in shape of the isotherms as the critical point is approached. At high temperature ![]() , the isotherms are expected to be the straight lines given either by the ideal gas equation of state
, the isotherms are expected to be the straight lines given either by the ideal gas equation of state ![]() or by the Curie law
or by the Curie law ![]() , where m is the mass of a molecule and c is a constant. As the temperature decreases toward the critical temperature
, where m is the mass of a molecule and c is a constant. As the temperature decreases toward the critical temperature ![]() , the isotherms develop curvature. At
, the isotherms develop curvature. At ![]() the isotherms are just flat and one have
the isotherms are just flat and one have ![]() and
and ![]() . As a consequence, the response functions, isothermal compressibility
. As a consequence, the response functions, isothermal compressibility ![]() and the isothermal susceptibility
and the isothermal susceptibility ![]() diverge as
diverge as ![]() . These response functions are second derivative of the respective free energy function:
. These response functions are second derivative of the respective free energy function: ![]() and
and ![]() . We see that the second derivatives of the free energy are singular (the first derivatives are continuous) as we expect in second order phase transitions.
. We see that the second derivatives of the free energy are singular (the first derivatives are continuous) as we expect in second order phase transitions.
Fluid |
Magnet |
|
|
Figure 2.5: Schematic plot of pressure P versus density ρ isotherms for a fluid system and of H versus M for a magnetic system. |
|