Many spectrum analyzer have the facility to plot several such graphs ‘in cascade’ or ‘waterfall diagram’, as shown in Figure 14.4. Such diagrams help to determine the relationship between the vibration signal and machine running speed, which in turn help in the monitoring of the machine condition. A waterfall diagram is a 3-dimensional plot of spectra at various speeds. Vibration signals are captures at different speeds and FFT of the signals are cascade as shown in Figure 14.4. Another version of the waterfall diagram in 2-dimension is shown in Figure 14.5, where the amplitudes of the vibrations are depicted by a circle with radius corresponding to the amplitude of vibration at particular frequency (i.e., 1x or integer multiples/divisions). The axis is chosen similar to the Campbell diagram, i.e., the spin speed of the rotor as abscissa and the frequency of whirl as the ordinate.
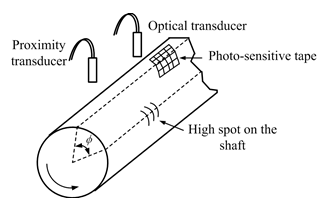
(a) The shaft and transducers
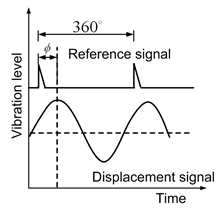
(b) Measured and reference signals
Figure 14.6 The measurement of the phase in a rotor
In rotor applications where phase is to be measured (as in constructing the Bode and Nyquist plots), a reference signal indicating a particular location on the shaft will be required in addition to the vibration signal which is to be measured as shown in Figure 14.6. This key phasor or reference signal might be obtained by using (i) a proximity transducer to detect the passing of a key way or a bolt head on the shaft or (ii) an optical transducer detecting the passing of photo-sensitive tape adhered to the shaft or alternatively some other signal which produces a well-defined that peak can be used. The key phasor signal is used in conjunction with the vibration signal; the phase angle recorded being that between the peaks of the two signals (see Figure 14.6(b)). An oscilloscope provides an immediate visual representation of the vibrational signal, enabling the engineer to observed the form of the signal (sine wave or otherwise), its frequency and its amplitude. This is known as “time domain” data representation.
Most oscilloscope provide “x and y” facility which allows two vibration signal from, say two proximity transducers maintained perpendicular to each other, to be input to the oscilloscope. These signals can be displaced in the form of a shaft whirl orbit instead of the normal time-base representation. The vibration of the rotor is a whirling motion and therefore not only the frequencies but also the directions of the whirling motions are important enough to pursue their causes. Some oscilloscopes enable a phase-indicating pulse of extra-bright beam to be displaced on the orbit once per revolution of the shaft, which indicates the direction of whirl. The shape of the orbit, trajectory, or Lissajous figure (Jules Antoine Lissajous (1822-1880) was a French physicist who was interested in waves, and around 1855 developed a method for displaying them optically by reflecting a light beam from a mirror attached to a vibrating object such as a tuning fork. You might wonder why he didn't just use an oscilloscope. It was probably because the Cathode Ray Tube hadn't been invented yet. It was invented in 1897 by Karl Ferdinand Braun. A Lissajous figure is produced by taking two sine waves and displaying them at right angles to each other. This is easily done on an oscilloscope in XY mode), can itself be a useful tool in monitoring machine health. A typical whirl orbit for a machine subject to a small amount of unbalance is shown in Figure 14.7 (as displayed on an oscilloscope).
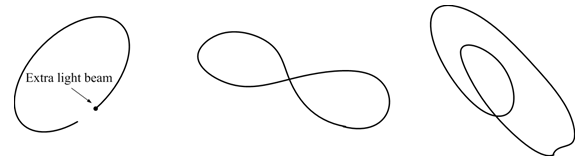
Figure 14.7 Lissajous plot
The orbit plot can be seen clearly for a simple rotor vibration when a single frequency is present in the measured signals. However, using a manual tracking filter the orbit plot can be obtained for 1´ or integer multiples/divisions of the rotational frequency of the rotor, which is a tedious process. In frequency domain, however, since the usual fast Fourier transform (FFT) theory gives information about magnitudes of frequencies and phases only, we cannot know the whirl direction using the conventional FFT-analyser. For this purpose, Ishida (1997) and Lee (2000) proposed a signal processing method where the whirling plane of a rotor is overlapped to the complex plane. This method is called the complex-FFT (or directional-FFT) method, enables us to know the directions of whirling motion besides the magnitudes of the frequencies. They also used this method to extract a component form non-stationary time histories obtained numeric simulations and experimented data and depicted the amplitude variation of the component. We will discuss fundamental ideas necessary to understand the signal processing by computer. In addition, applications of the complex-FFT method in studying stationary and non-stationary vibrations are explained.
Once the vibration signals have been collected and measured, they are used to judge whether or not the machine in question is operating properly. These judgments are made on the basis of whether there are unusual features of vibration signal which are not normally present, or which may usually be present under particular fault conditions. However, to generate such plots and use various functions correctly, we must have some background knowledge of signal processing. Moreover, if we have to construct a specific data analysis system that fits our research for example for system parameter estimation (i.e., the crack parameter, bearing and seal dynamic parameters, residual unbalance, misalignment, etc.), we must have sufficient understanding of the fundamental of the signal processing.