In previous chapter, we studied various kinds of transducers, measuring and analyses equipments, and exciters used in the vibration and acoustics field especially related to rotating machineries. These transducers produce the signals in the form of charge or voltage. Through amplifiers these signals are fed to the data acquisition system to digitize these signals into a computer. In the present chapter, the main focus would be to study methods involved in the processing these signals in various required form in time domain (mean, variance, probability density function, auto-correlation function, cross-correlations, etc.), frequency domain (fast Fourier Transform function, FFT; power spectrum, etc.) and time-frequency domain (short-time-Fourier-transform, STFT; wavelet transform, WT; etc.). Various graphical forms of display of these measurements are presented. Error involved in the measurement (mechanical, electrical or digital) itself would be addressed. These include error due to the aliasing effect, error in digitizing, leakage error, etc. Tuning of sampling and signal periodicity, effects due to windowing, etc. will be discussed in improving the data quality. Fourier series, Fourier transform, discrete Fourier transform, FFT and complex-FFT would be covered in some detail. In the subsequent chapter, various fault conditions and its effects on the vibration signature will be looked in.
14.1 Display of Vibration Measurements
Vibration signal generated has to be measured and displayed. The quantities that have to be measured are usually vibration amplitude, its frequency and its phase. The history of the vibration measurement in the form of digital display (through vibration meter) gives only the trend of vibration level (peak-to-peak, RMS, spike ratio, mean, standard deviation, skewness, kurtosis, etc.), which might give only indication about the condition of the machine whether machine is in good or bad condition. However, the cause of the increased vibration level at the component level is difficult to assign with such lone measurement of vibration level by vibration meter. To investigate the causes of vibration in component level, one needs to investigate the relationship between the vibration signal frequencies and the rotational speed of the shaft. In principle, every fault has a unique frequency (or frequencies) to contribute in the overall vibration signal, especially in rotating machinery different faults at the component level might contribute vibration frequencies in integer multiples (or divisions) of rotational frequency of component speeds. This can be done by the spectrum analysis with the help of FFT-analyzer (fast Fourier transformation) equipments. Spectrum analysers have various convenient functions, such as FFT, tracking analysis (Bode plot, Nyquist plot), waterfall diagram, Campbell diagram, etc.
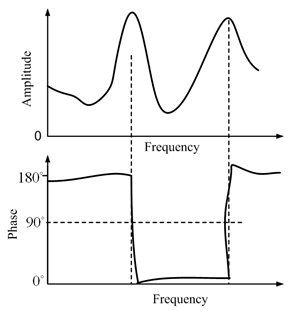
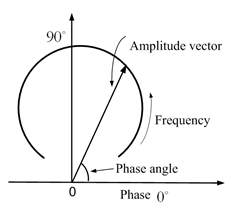
A tracking filter is a device that accepts two input signals, one being the vibration signal under consideration and the other being a phase reference signal. In the tracking analysis, dynamic characteristics of a rotating machine are investigated by measuring vibrations for the run-up or rundown of the machinery, which is a practical way of getting dynamic behaviour of the machinery at various operational speeds. The tracking of the vibration signal is done normally at 1x rotational speed of the rotor (or integer multiples of it). The tracking filter removes from the vibration signal any components, which are not of the same frequency as the reference signal. The amplitude and phase (relative to the reference signal) of the remaining signal are then displayed, usually in digital form. The output from a tracking filter can be used to construct the Bode and Nyquist diagrams (Figs. 14.1 and 14.2) used, for example, during balancing operations or damping estimation. This can be done several ways for example (i) by manually tuning the narrow band-pass filter to the required central frequency (1 × or integer multiples of rotational speed of rotors) and measuring the vibration level by vibration meter, (ii) tuning the central frequency as in method (i), however, displaying the signal in the oscilloscope to take required measurement, and (iii) measuring the vibration signal continuously for the total run-up or rundown period and processing the signal afterwards in computer. Apart from the amplitude of vibration often it is required to measure the phase of the vibration signal with respect to some fixed reference on the rotating component, which is called the reference signal. A phase meter can be used for method I which requires two signals, i.e., first the vibration signal and the other is the reference signal. For method II both the signals could be displayed on the same screen and relative phase can be measured. In method III vibration signals and the reference signal have to recaptured at various small time period and amplitude and phase of the vibration signal can be measured by displaying it on the computer screen or by advance signal processing software.
|
|
14.1 Bode plot (the variation of the amplitude and phase with the rotational frequency of rotor) |
Fig. 14.2 Nyquist plot |