The vibration amplitude and the phase so obtained, which is called the frequency response function, can be displayed as the Bode and Nyquist plots as shown in Figures 14.1 and 14.2 (the Bode plot as shown is for multi-DOF system whereas the Nyquist plot is plot of one of the resonance peak or for single-DOF system). The amplitude of the Bode plots should be plotted in semi-logarithmic scale when the peak at the resonance is very sharp with very high magnitudes. The Nyquist plot to be considered as blown view of a single resonance peak and this plot is very useful for obtaining the modal damping (Ewins, 1984). In the Nyquist plot, it is shown that both the amplitude and phase information of the Bode plot is merged in a single Nyquist plot. The frequency information is indicated along the circumference of the circle of the Nyquist plot. It can easily be seen that the Nyquist plot is a complex plane with the horizontal axis as real axis and the vertical axis as the imaginary axis. This will be more clear when we see the Bode plot information can also be plotted as the real and imaginary part of the signal with respect to the frequency (i.e., XejΦ = X cosΦ + j sinΦ = Xr + jXi; where X is the amplitude,Φ is the phase, X is the real part and is the imaginary part).
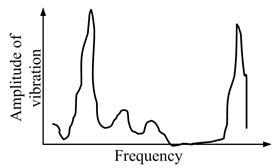
Figure 14.3 Spectrum diagram (FFT of a capture signal)
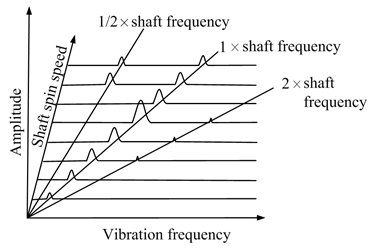
Figure 14.4 Waterfall diagram (FFT of captured signals at different speeds)
Both the diagrams (Bode and Nyquist plots) should be plotted using readings, which have been ‘nulled’ by responses at slow speed and between critical speeds, thereby removing the effects of run-out and the effects of vibration modes which do not relate to the critical speed under consideration. Depending upon the vibration parameters, i.e., the displacement, velocity and acceleration, the FRF (frequency response function, i.e., the ratio of the response to the force) is called respectively the receptance, mobility, and inertance. The inverse of FRF corresponding to the displacement, velocity and acceleration measurements are called respectively the dynamic stiffness, the mechanical impedance and the apparent mass.
The spectrum diagram is the plot of captured unfiltered vibration signal in frequency domain (or may be filtered with the broad band-pass filter to remove the unnecessary noise). It is obtained by performing the FFT of the captured signal at a particular instant of time and one such spectrum diagram is shown in Figure 14.3. The spectrum analyser is used to separate out the incoming vibration signal into all of frequencies from which the total signal is composed. The amplitude and phase, relative to some reference signal, of all the frequency components is displayed in the form of a graph of amplitude (or phase) against frequency. The data is thus said to be displayed in the frequency domain.
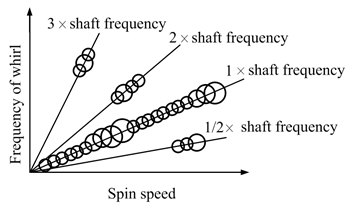
Figure 14.5 Campbell diagram