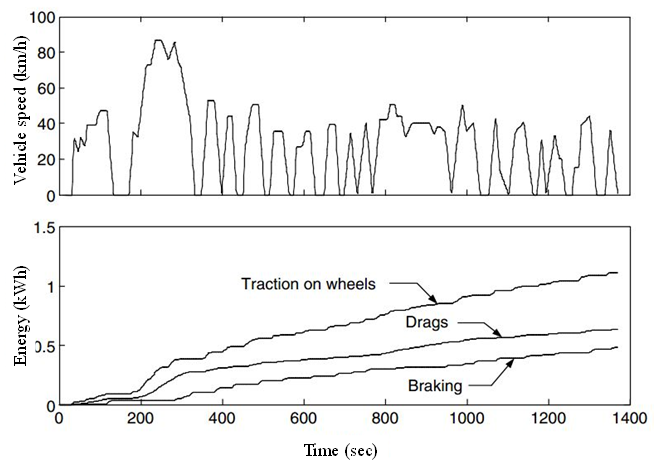
 Figure 2: Total traction energy and energies consumed by drags and braking in an FTP 75 urban
drive cycle [2]
Initially, assuming that the braking distribution on the front and rear wheels follow the curve I (refer to Chapter 2), ignoring vehicle drags, the braking forces on the front and rear wheels can be expressed as: 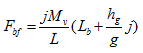
and 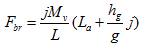
where j is the deceleration of the vehicle in m / s2, L is the wheel base of the vehicle, La and Lb are the horizontal distances between the vehicle gravity center to the center of the front and rear wheels, respectively, and hg is the height of the gravity center of the vehicle to the ground. Figure 3 shows vehicle speed and acceleration/deceleration in an FTP 75 urban drive cycle.
Figures 4 - 6 show the braking force, braking power, and braking energy of a 1500 kg passenger car in an FTP 75 urban drive cycle. This example has parameters of L = 2.7 m, La = 0.4 L , Lb = 0.6 L, and hg = 0.55 m.
Figures 4 - 6 indicate that:
i) The front wheels consume about 65% of the total braking power and energy. Thus, regenerative braking on front wheels, if available only on one axle, is more effective than on rear wheels.
ii) The braking force is almost constant in the speed range of less than 50 km / h and decreases when the speed is greater than 40 km / h. This characteristic naturally matches that of an electric motor that has a constant torque at the low-speed region and a constant power at the high-speed region. Further, Figure 6 indicates that most braking energy is consumed in the speed range of 10 to 50 km/h.