Figure 2 shows the actual magnitude and phase plot as drawn in MATLAB.
![\includegraphics[width=13cm]{m5l5fig2.eps}](images/img27.png) |
Figure 2: Bode magnitude and phase plot for Example 1
1.1 Gain margin and Phase margin
Gain margin and phase margins are the measures of relative stability of a system.
Similar to continuous time case, we have to first define phase and gain cross over frequencies before defining gain margin and phase margin.
Gain margin is the safety factor by which the open loop gain of a system can be increased before the system becomes unstable. It is measured as
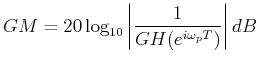
where ωp is the phase crossover frequency which is defined as the frequency where the phase of the loop transfer function ![]() is 180°.
is 180°.
Similarly Phase margin (PM) is defined as
![]()
where ωg is the gain crossover frequency which is defined as the frequency where the loop gain magnitude of the system becomes one.