1 Bode Plot
Bode plot is the graphical tool for drawing the frequency response of a system.
It is represented by two separate plots, one is the magnitude vs frequency and the other one is phase vs frequency.The magnitude is expressed in dB and the frequency is generally plotted in log scale.
One of the advantages of the Bode plot in s-domain is that the magnitude curve can be approximated by straight lines which allows the sketching of the magnitude plot without exact computation.
This feature is lost when we plot Bode diagram in z-domain . To incorporate this feature we use bi-linear transformation to transform unit circle of the z-plane into the imaginary axis of another complex plane, w plane, where
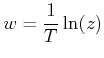
From the power series expansion
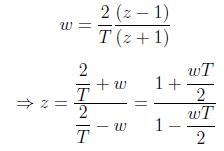
For frequency domain analysis the above bi-linear transformation may be used to convert GH(z) to GH(w) and then construct the Bode plot.
Example 1: Let us consider a digital control system for which the loop transfer function is given by
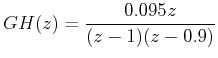
where sampling time T = 0.1 sec. Putting 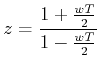 , we get the transfer function in w plane as
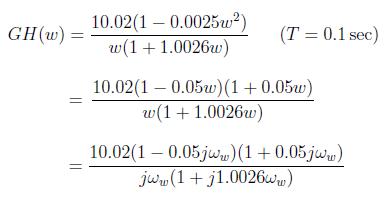
where ![]() is the frequency in w plane. Corner frequencies are 1/1.0026 = 0.997 rad/sec and 1/0.05 = 20 rad/sec.
is the frequency in w plane. Corner frequencies are 1/1.0026 = 0.997 rad/sec and 1/0.05 = 20 rad/sec.