For Compressive strength data
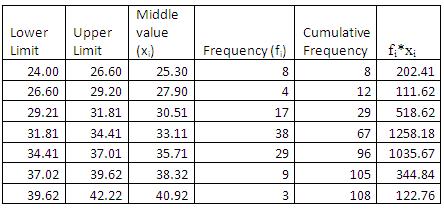
Table 2.5: Calculations for computing the mean, mode, and median for the grouped data on compressive strength of concrete
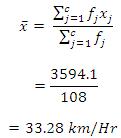
Mean
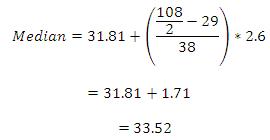
Median
![]()
From Table 2.5 the following information can be obtained;
Lower limit of the median class, Lm : 31.81
N = 108
Frequency up to the median class, F: 29
Frequency corresponding to the median class, fm : 38
Class width, c: 2.6
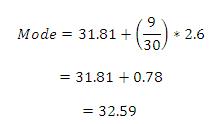
Mode
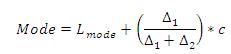
Lower limit of the mode class, Lmode : 31.81
Frequency difference between the modal class and the next class, Δ1: 9
Frequency difference between the modal class and the previous class, Δ2: 21
Class width, c: 4
Based on the values of mean, mode, median it can be said that the distribution of the compressive strength data are also approximately symmetrical (Figure 2.6).
Summary
Numerical and the graphical descriptions of the data discussed here are useful in understanding the nature of the experimental/natural outcomes. This is one of the easier ways of understanding the information available in the data. But this alone may not be enough to predict the outcomes of the man made experiments and the natural events. Probability concepts are useful in understanding and modeling the evolution of these experimental outcomes. Probability concepts are necessary for better use of the data available from the natural or manmade experiments. Simply finding the mean or standard deviation of the data on compressive strength is not enough and the probability concepts help in utilizing the data to understand the experiment itself.