Grouped Data
When dealing with a large set of data, it is necessary to group the data into different classes and the formulae used for computing the mean and the standard deviation are different.
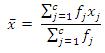
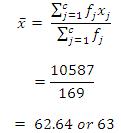
If the data is grouped into c different classes and fj is the frequency of the data in the jth class, and xj is the midpoint of the class then the mean is computed as follows;
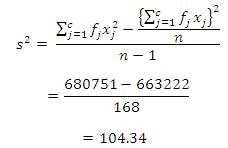
Variance is computed using the frequency data as follows;
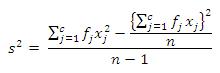
Where c is number of classes and fj is the frequency in the jth interval.
Median for the grouped data
Median for the grouped data can be obtained in the following way;
- Get the cumulative frequencies and find out the class in which the median is falling. This is known as the median class. Absolute frequency corresponding to this class is termed as the frequency of median class, and it is denoted with fm.
- Cumulative frequency up to the class before the median class is denoted with the letter F.
- The median can be computed as follows;
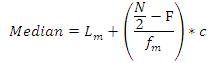
Where, Lm is the lower limit of the median class, c is the class width, and N is the total frequency.
Mode for the grouped data
If the data are not grouped, as discussed earlier, the mode is the value which has the highest frequency in the data set. In case of grouped data the modal class is the class with the highest frequency. For grouped data the mode is computed as described below;
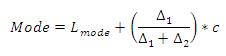
Where, Lmode is the lower limit of the modal class, Δ1 is the frequency difference between the modal class and the next class, Δ2 is the frequency difference between the modal class and the class before the modal class.
Example
For the speed data given in Table 2.1 the mean and the standard deviation can be found by dividing the data into several classes of equal length. The calculations are shown in Table 2.4.
Mean of the frequency data is,
Similarly, the standard deviation is,