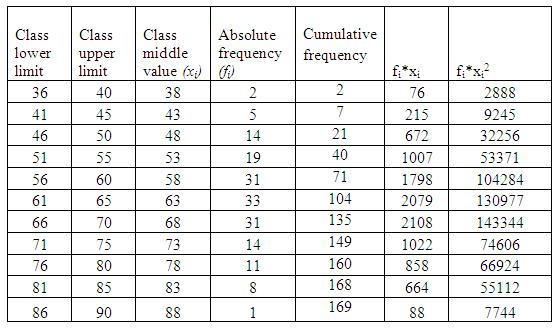
Table 2.4: Calculations for computing the mean and standard deviation for the grouped data on speed
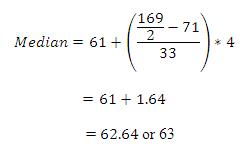
Median
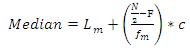
From Table 2.4 the following information can be obtained;
Lower limit of the median class, Lm : 61
N = 169
Frequency up to the median class, F: 71
Frequency corresponding to the median class, fm : 33
Class width, c: 4
Mode
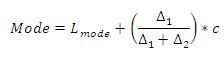
Lower limit of the mode class, Lmode : 61
Frequency difference between the modal class and the next class, Δ1: 2
Frequency difference between the modal class and the previous class, Δ2: 2
Class width, c: 4
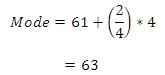
It can be seen that the all the three values (mean, mode, and median for the speed data) are equal to 63, hence this distribution can be called as the symmetric distribution.