When the class width is not small the density function can be obtained by dividing the relative frequencies with the class width (known as the relative frequency density) and plotting these values in the form of a relative frequency polygon. Area of the relative frequency diagram shown in Figure 2.2 is not equals to one hence the relative frequencies are to be divided with the class width. The same is shown in Figure 2.4 for the speed data given in Table 2.1.
Table 2.2: Grouping of Speed data of cars and frequency computations
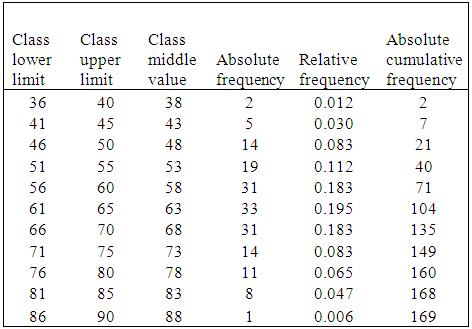
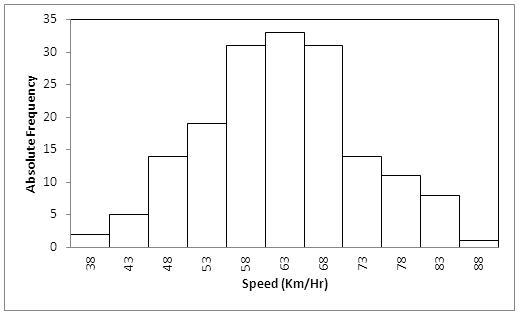
Figure 2.1: Frequency histogram of the free flow speed data of cars
Figure 2.2: Relative frequency histogram of the free flow speed data of cars