The comparison of above alternatives using incremental B/C ratio analysis as shown in Table 2.8 is briefly presented below.
- The lowest equivalent cost alternative A1 is compared against the do-nothing alternative (initial base alternative). In other words B/C ratio of alternative A1 on its total cash flow is calculated. The obtained B/C ratio is 1.150 which is greater than 1.0. Thus alternative A1 now becomes the new base alternative.
- Now alternative A1 is compared against the next higher equivalent cost alternative i.e. A2. The incremental B/C ratio between alternatives A2 and A1 is calculated. The calculated incremental B/C ratio is 1.356 which is greater than 1.0. Thus alternative A2 now becomes the base alternative and alternative A1 is eliminated from further analysis.
- Alternative A2 is now compared against the next higher equivalent cost alternative i.e. alternative A4. The calculated incremental B/C ratio between alternatives A4 and A2 is 1.414 (greater than 1.0). Alternative A4 now becomes the base alternative and alternative A2 is eliminated.
- Alternative A4 is now compared against the next higher equivalent cost alternative i.e. alternative A3 (last alternative). The incremental B/C ratio between alternatives A3 and A4 is 0.906 which is less than 1.0. Thus the incremental cost associated with alternative A3 is not justified. Hence alternative A4 is selected as the best alternative as no other alternative is left for comparison. In other words alternative A4 is the highest equivalent cost alternative which is associated with the last justified increment i.e. incremental B/C ratio greater than 1.0.
It may be noted here that the B/C ratios of the alternatives on their individual cash flows could have been calculated at the beginning of the analysis to eliminate any alternative(s) that has a B/C ratio less than 1.0 and that alternative(s) need not be considered further in the incremental benefit-cost ratio analysis. However this step is not necessary because the alternative with B/C ratio less than 1.0 on its cash flow will eliminated in the process of incremental analysis. In this example the values of B/C ratio of the alternatives A1, A2, A3 and A4 on their individual cash flows are 1.150, 1.158, 1.146 and 1.166 respectively (all greater than 1.0). The calculation of B/C ratio is shown only for alternative A1. The B/C ratio of other alternatives can be similarly calculated.
The above incremental B/C ratio analysis was carried out using conventional B/C ratio. The same analysis can also be carried out by using modified B/C ratio. As already stated, in modified B/C ratio, the operating and maintenance cost is subtracted from the benefits in the numerator. The incremental B/C ratio analysis using modified B/C ratio for the comparison of above mutually exclusive alternatives is describe below.
The order of alternatives from lowest to highest equivalent cost (present worth of cost) will depend only on the initial investment as the annual operating and maintenance cost (considered similar to disbenefits) is subtracted from the benefits in the numerator of modified B/C ratio. Thus the order of alternatives from lowest to highest equivalent cost (i.e. initial investment) is A1, A2, A4 and A3 (same as earlier). Now the incremental benefit-cost analysis using modified B/C ratio is carried out in the same manner as that was done using conventional B/C ratio and is presented in Table 2.9.
Table 2.9 Comparison of alternatives using incremental B/C ratio** analysis
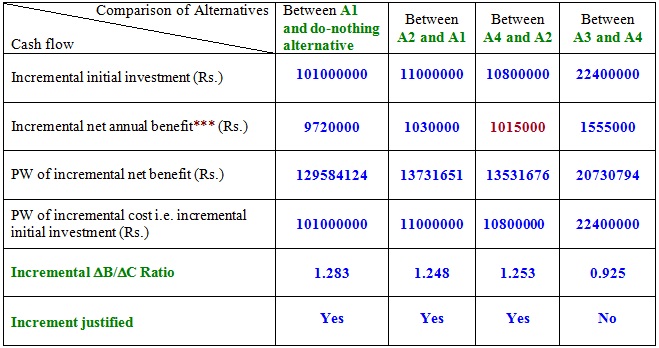
** Modified B/C ratio
*** Net annual benefit for an alternative is obtained by subtracting the annual operating and maintenance cost from its annual benefits. Incremental net annual benefit is the difference in net annual benefits between two alternatives. Considering the comparison between alternatives A4 and A2, the calculation of incremental net annual benefit is shown below.
The net annual benefit of alternative A2 = annual benefits - annual operating and maintenance cost
= 17200000 - 6450000 = 10750000
The net annual benefit of alternative A4 = annual benefits - annual operating and maintenance cost
= 17900000 - 6135000 = 11765000
The incremental net annual benefit between A4 and A2 = 11765000 - 10750000 = 1015000
Thus the incremental net annual benefit between two alternatives A4 and A2 is Rs.1015000, which is shown in Table 2.9.
From Table 2.9, it is observed that the best alternative is A4, which is same as the outcome obtained from incremental B/C ratio analysis using the conventional B/C ratio. In other words the same outcome regarding the best alternative is obtained, however the values of B/C ratios obtained were different. Similar to present worth, the incremental B/C ratio analysis can also be carried out by calculating the annual worth (AW) or future worth (FW) of benefits and costs of alternatives.