| |
| | |
|
Capacity at signalized intersections is based on the concept of saturation flow
and defined saturation flow rate.
The flow ratio for a given lane group is defined as the ratio of the actual or
projected demand flow rate for the lane group ( ) and the saturation flow
rate( ) and the saturation flow
rate( ).
The flow ratio is given the symbol (v/s)i for lane group i.
Capacity at signalized I/S is based on the saturation flow and saturation flow
rate. ).
The flow ratio is given the symbol (v/s)i for lane group i.
Capacity at signalized I/S is based on the saturation flow and saturation flow
rate.
 |
(1) |
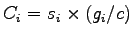
where  = capacity of lane group i (veh/h), = saturation flow rate
for lane group i (veh/h) and = capacity of lane group i (veh/h), = saturation flow rate
for lane group i (veh/h) and  = effective green ratio for lane group i.
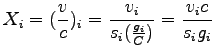
The ratio of flow rate to capacity (v/c), often called the volume to capacity
ratio, is given the symbol X in intersection analysis = effective green ratio for lane group i.
The ratio of flow rate to capacity (v/c), often called the volume to capacity
ratio, is given the symbol X in intersection analysis
 |
(2) |
where,  = (v/c)i = ratio for lane group i, = actual or projected
demand flow rate for lane group i (veh/h), = saturation flow rate for
lane group i (veh/h), = (v/c)i = ratio for lane group i, = actual or projected
demand flow rate for lane group i (veh/h), = saturation flow rate for
lane group i (veh/h),  = effective green time for lane group i (s) and C =
cycle length (s)
Another concept used for analyzing signalized intersections is the critical v/c
ratio, = effective green time for lane group i (s) and C =
cycle length (s)
Another concept used for analyzing signalized intersections is the critical v/c
ratio,  .
This is the v/c ratio for the intersection as a whole, considering only the
lane groups that have the highest flow ratio (v/s) for a given signal phase.
For example, with a two-phase signal, opposing lane groups move during the same
green time.
Generally, one of these two lane groups will require more green time than the
other (i.e., it will have a higher flow ratio).
This would be the critical lane group for that signal phase.
The critical v/c ratio for the intersection is determined by using Equation, .
This is the v/c ratio for the intersection as a whole, considering only the
lane groups that have the highest flow ratio (v/s) for a given signal phase.
For example, with a two-phase signal, opposing lane groups move during the same
green time.
Generally, one of these two lane groups will require more green time than the
other (i.e., it will have a higher flow ratio).
This would be the critical lane group for that signal phase.
The critical v/c ratio for the intersection is determined by using Equation,
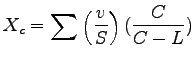 |
(3) |
where, = critical v/c ratio for intersection; The above eqn. is useful in
evaluating the overall i/s w.r.t the geometric and total cycle length.
A critical v/c ratio less than 1.0, however, does indicate that all movements
in the intersection can be accommodated within the defined cycle length.
|
|
| | |
|
|
|