| |
| | |
|
A saturation flow rate for each lane group is computed according to above
equation.
The saturation flow rate is the flow in vehicles per hour that can be
accommodated by the lane group assuming that the green phase were displayed 100
percent of the time (i.e., g/C = 1.0).
 |
(1) |
where, S = saturation flow rate for subject lane group, expressed as a total
for all lanes in lane group (veh/h);  = base saturation flow rate per
lane (pc/h/ln); N = number of lanes in lane group; = base saturation flow rate per
lane (pc/h/ln); N = number of lanes in lane group;  = adjustment factor
for lane width; = adjustment factor
for lane width;  = adjustment factor for heavy vehicles in traffic
stream; = adjustment factor for heavy vehicles in traffic
stream;  = adjustment factor for approach grade; = adjustment factor for approach grade;  = adjustment
factor for existence of a parking lane and parking activity adjacent to lane
group; = adjustment
factor for existence of a parking lane and parking activity adjacent to lane
group;  = adjustment factor for blocking effect of local buses that
stop within intersection area; = adjustment factor for blocking effect of local buses that
stop within intersection area;  = adjustment factor for area type; = adjustment factor for area type;
 = adjustment factor for lane utilization; = adjustment factor for lane utilization;  = adjustment factor
for left turns in lane group; = adjustment factor
for left turns in lane group;  = adjustment factor for right turns in
lane group; = adjustment factor for right turns in
lane group;  = pedestrian adjustment factor for left-turn movements;
and = pedestrian adjustment factor for left-turn movements;
and  = pedestrian-bicycle adjustment factor for right-turn movements.
For the analysis of saturation flow rate, a fixed volume is taken as a base
called base saturation flow rate, usually 1,900 passenger cars per hour per
lane (pc/h/ln).
This value is adjusted for a variety of conditions.
The adjustment factors are given below.
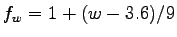
The lane width adjustment factor fw accounts for the negative impact of narrow
lanes on saturation flow rate and allows for an increased flow rate on wide
lanes.
The lane width factor can be calculated for lane width greater than 4.8m.
The use of two narrow lanes will always result in higher saturation capacity
than one single wide lane. = pedestrian-bicycle adjustment factor for right-turn movements.
For the analysis of saturation flow rate, a fixed volume is taken as a base
called base saturation flow rate, usually 1,900 passenger cars per hour per
lane (pc/h/ln).
This value is adjusted for a variety of conditions.
The adjustment factors are given below.
The lane width adjustment factor fw accounts for the negative impact of narrow
lanes on saturation flow rate and allows for an increased flow rate on wide
lanes.
The lane width factor can be calculated for lane width greater than 4.8m.
The use of two narrow lanes will always result in higher saturation capacity
than one single wide lane.
 |
(2) |
where, w = width of lane
passenger cars are affected by approach grades, as are heavy vehicles.
The heavy-vehicle factor accounts for the additional space occupied by these
vehicles and for the difference in operating capabilities of heavy vehicles
compared with passenger cars.
The passenger-car equivalent (ET) used for each heavy vehicle is 2.0
passenger-car units and is reflected in the formula.
The grade factor accounts for the effect of grades on the operation of all
vehicles.
where, % HV = % heavy vehicles for lane group volume,  = 2.0, % G = %
grade on a lane group approach
Parking maneuver assumed to block traffic for 18 s.
Use practical limit of 180 maneuvers/h.
The parking adjustment factor, = 2.0, % G = %
grade on a lane group approach
Parking maneuver assumed to block traffic for 18 s.
Use practical limit of 180 maneuvers/h.
The parking adjustment factor,  , accounts for the frictional effect of a
parking lane on flow in an adjacent lane group as well as for the occasional
blocking of an adjacent lane by vehicles moving into and out of parking spaces.
Each maneuver (either in or out) is assumed to block traffic in the lane next
to the parking maneuver for an average of 18 s. , accounts for the frictional effect of a
parking lane on flow in an adjacent lane group as well as for the occasional
blocking of an adjacent lane by vehicles moving into and out of parking spaces.
Each maneuver (either in or out) is assumed to block traffic in the lane next
to the parking maneuver for an average of 18 s.
![$\displaystyle f_P = [ N - 0.1 - (18N_m/3600 ) ] / N$](img22.png) |
(5) |
where,  = number of parking maneuvers/h, N = no. of lanes
The bus blockage adjustment factor, , accounts for the impacts of local
transit buses that stop to discharge or pick up passengers at a near-side or
far-side bus stop within 75 m of the stop line (u/s or d/s).
If more than 250 buses per hour exist, a practical limit of 250 should be used.
The adjustment factor can be written as, = number of parking maneuvers/h, N = no. of lanes
The bus blockage adjustment factor, , accounts for the impacts of local
transit buses that stop to discharge or pick up passengers at a near-side or
far-side bus stop within 75 m of the stop line (u/s or d/s).
If more than 250 buses per hour exist, a practical limit of 250 should be used.
The adjustment factor can be written as,
![$\displaystyle f_{bb} = [N - (14.4 N_B/3600)] /N$](img24.png) |
(6) |
where,  = no. of buses stopping per hour
The area type adjustment factor, fa, accounts for the relative inefficiency of
intersections in business districts in comparison with those in other
locations. Application of this adjustment factor is typically appropriate in
areas that exhibit central business district (CBD) characteristics.
It can be represented as, = no. of buses stopping per hour
The area type adjustment factor, fa, accounts for the relative inefficiency of
intersections in business districts in comparison with those in other
locations. Application of this adjustment factor is typically appropriate in
areas that exhibit central business district (CBD) characteristics.
It can be represented as,
 = 0.9 in CBD (central business district)
and = 1.0 in all others
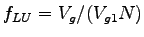
The lane utilization adjustment factor, fLU, accounts for the unequal
distribution of traffic among the lanes in a lane group with more than one
lane.
The factor provides an adjustment to the base saturation flow rate.
The adjustment factor is based on the flow in the lane with the highest volume
and is calculated by Equation 10. = 0.9 in CBD (central business district)
and = 1.0 in all others
The lane utilization adjustment factor, fLU, accounts for the unequal
distribution of traffic among the lanes in a lane group with more than one
lane.
The factor provides an adjustment to the base saturation flow rate.
The adjustment factor is based on the flow in the lane with the highest volume
and is calculated by Equation 10.
 |
(7) |
where,  = unadjusted demand flow rate for lane group (veh/ h), = unadjusted demand flow rate for lane group (veh/ h),  =
unadjusted demand flow rate on single lane with highest volume in the lane
group and N = no. of lanes in the group. =
unadjusted demand flow rate on single lane with highest volume in the lane
group and N = no. of lanes in the group.
|
|
| | |
|
|
|