| |
| | |
|
Level of service (LOS) is a qualitative term describing the operational
performance of any transportation facility.
The qualitative performance measure can be defined using various quantitative
terms like:
- Volume to capacity ratio,
- Mean passenger car speed,( in km/h)
- Density, (in p/kmln).
Basically any two of the following three performance characteristics can
describe the LOS for a multilane highway.
Each of these measures can indicate how well the highway accommodates the
traffic demand since speed does not vary over a wide range of flows, it is not
a good indicator of service quality.
Density which is a measure of proximity of other vehicles in the traffic
stream and is directly perceived by drivers and does not vary with all flow
levels and therefore density is the most important performance measure for
estimating LOS.
Based on the quantitative parameter, the LOS of a facility can be divided into
six qualitative categories, designated as LOS A,B,C,D,E,F The definition of
each level of service, is given below:
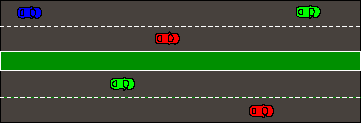
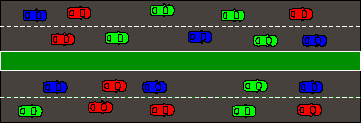
Travel conditions are completely free flow.
The only constraint on the operation of vehicles lies in the geometric features
of the roadway and individual driver preferences.
Lane changing, merging and diverging manoeuvre within the traffic stream is
good, and minor disruptions to traffic are easily absorbed without an effect on
travel speed.
Average spacing between vehicles is a minimum of 150 m or 24 car lengths.
Fig. 1 shows LOS A.
Figure 1:
LOS A
 |
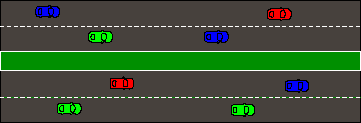
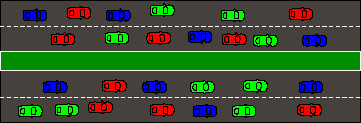
Travel conditions are at free flow.
The presence of other vehicles is noticed but it is not a constraint on the
operation of vehicles as are the geometric features of the roadway and
individual driver preferences.
Minor disruptions are easily absorbed, although localized reduction in LOS are
noted.
Average spacing between vehicles is a minimum of 150 m or 24 car lengths.
Fig. 2 below shows LOS B.
Figure 2:
LOS B
 |
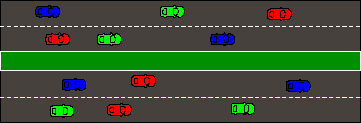
Traffic density begins to influence operations.
The ability to manoeuvre within the traffic stream is affected by other
vehicles.
Travel speeds show some reduction when free-flow speeds exceed 80 km/h.
Minor disruptions may be expected to cause serious local deterioration in
service, and queues may begin to form.
Average spacing between vehicles is a minimum of 150 m or 24 car length.
Fig. 3 shows LOS C.
Figure 3:
LOS C
 |
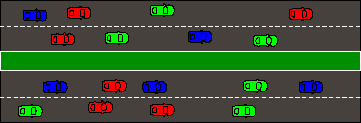
The ability to manoeuvre is severely restricted due to congestion.
Travel speeds are reduced as volumes increase.
Minor disruptions maybe expected to cause serious local deterioration in
service, and queues may begin to form.
Average spacing between vehicles is a minimum of 150 m or 24 car length.
Fig. 4 shows LOS D.
Figure 4:
LOS D
 |
Operations are unstable at or near capacity.
Densities vary, depending on the free-flow speed.
Vehicles operate at the minimum spacing for which uniform flow can be
maintained.
Disruptions cannot be easily dissipated and usually result in the formation of
queues and the deterioration of service to LOS F.
For the majority of multilane highways with free-flow speed between 70 and
100km/h, passenger-car mean speeds at capacity range from 68 to 88 km/h but are
highly variable and unpredictable.
Average spacing between vehicles is a minimum of 150 m or 24 car length.
Fig. 5 shows LOS E.
Figure 5:
LOS E
 |
A forced breakdown of flow occurs at the point
where the numbers of vehicles that arrive at a point exceed the number of
vehicles discharged or when forecast demand exceeds capacity.
Queues form at the breakdown point, while at sections downstream they may
appear to be at capacity.
Operations are highly unstable, with vehicles experiencing brief periods of
movement followed by stoppages.
Travel speeds within queues are generally less than 48 km/h.
Note that the term LOS F may be used to characterize both the point of the
breakdown and the operating condition within the queue.
Fig. 6 shows LOS F.
Figure 6:
LOS F
 |
|
|
| | |
|
|
|