|
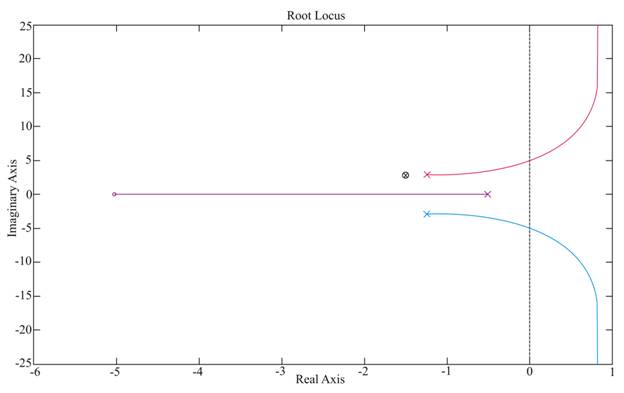 Fig. IV.10: Root Locus diagram
 The Fig. IV.10 demonstrates the root locus diagram of the said example. The loci of the complex pair of poles cross the imaginary axis at ![]()
Let us take a second example where transfer function of a process is
(IV.46) |
The characteristic equation is
(IV.47) |
The following table shows the values of roots of the characteristic equation as ![]() changes
from 0 to
changes
from 0 to ![]() .
.