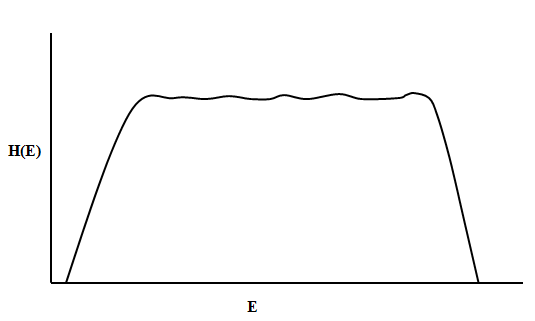
Figure 9.5: Schematic representation of combined histogram, H(E) for temperature ranges from T1 to T10, shown in Figure 9.4.
|
(5) |
Using the partition function, we can calculate the Helmholtz free energy as a function of ![]()
|
(5) |
Thus, we obtain the free energy as a function of the energy state as:
|
(6) |
For studying nucleation, we need to estimate the critical nucleus size and the energy barrier for the nucleation, viz. we require the dependence of the free energy on the nucleus size. In our simulations, we have noted that the total energy of the system, increases proportionally with the average crystallite size (S). Thus, from the obtained relationship, F (E) vs. E , we can relate the average energy of the system to the average nucleus size, S , and thus, are able to transform our data to F (S) vs. S .