From the free energy profile spanning from melt to crystal state, we can predict the states of the system corresponding to the critical nucleus, the incipient of phase transition.
At each T, generate a histogram over a large number of conformations. Construct a histogram, H(E) , based on the scaled total energy ( E ) of the system. Note that histograms at various temperatures should have significant overlap region (Figure 9.4) so that the combined histogram over the entire range would be a flat histogram (Figure 9.5). This flat energy histogram, ensures that the all the energy states within the temperature range, are sampled with equal probability. From the energy histograms, H ( E ), the probability of finding a system at β, at the energy state E , is given by:
|
(1) |
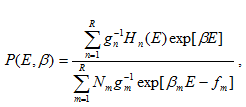
where Nm is the number of conformations sampled at the m -th simulation; gm represents the statistical inefficiency, and is related to the correlation time, Τm, for the m -th simulation. If all the successive conformations sampled for the histogram, are independent, gm = 1 otherwise,![]() ; is the parameter equal to the free energy at
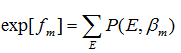
; is the parameter equal to the free energy at ![]() ,for the m -th simulation; R is total number of NVT simulations performed. The probability, P ( E , b ), and free energy,
,for the m -th simulation; R is total number of NVT simulations performed. The probability, P ( E , b ), and free energy, ![]() are related by the following relation:
are related by the following relation:
|
(2) |