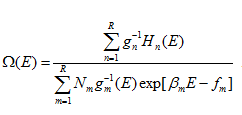
Thus, equations 1 and 2 need to be solved self-consistently, to obtain the free energy values, fm for each value of T. Using these free energies, the density of states and average properties (i.e., E ) are then calculated from the following expressions:
|
(3) |
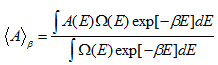
and the average quantity of an observable, A , is then calculated as
|
(4) |
From the DOS, we obtain the partition function, Z , as:
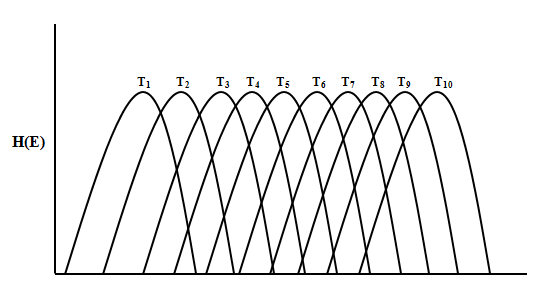
Figure 9.4: Schematic representation of energy histogram, H(E) for temperature ranges from T1 to T10.