The major problem associated with Raman spectroscopy is the very weak intensity of the scattered light. Consequently, it requires an extremely monochromatic high-energy light source, very effective filtering of Stokes scattering and very high sensitivity of the detecting device. Excitation source must be strong enough to generate sufficient Raman signals and monochromatic to provide clean and uncomplicated spectra. A laser typically is used as the excitation source because it can provide a coherent beam of monochromatic light with high intensity. Different laser beams in ultraviolet (UV), visible (Vis) or near infrared (NIR) range are used. Argon and krypton ion laser sources, being more intense, give better spectra and are the most commonly used. Light scattered from a laser excited sample is collected with a lens and is sent through filters to a monochromator. Raman scattering is effectively separated from Rayleigh scattering by multiple monochromators. At present, various arrangements such as notch filters, tunable filters, laser stop apertures, double and triple spectrometric systems are used to reduce Rayleigh scattering and obtain high-quality Raman spectra. Types of detectors mainly used are photomultiplier tube, photo diode array or charge coupled device.
Sample preparation
Raman analysis require no special sample preparation. All kind of samples in form of liquids, solids or gas can be analyzed. Short measuring time, normally a few seconds, is required to obtain a Raman spectrum.
Applications
Raman shift provides information about vibrational, rotational and other low frequency transitions in molecules. Used qualitatively for study of molecular structures. It is generally not used for quantitative studies, since due to weak Raman scattering, sensitivity is low.
Raman spectroscopy is complementary to IR spectroscopy. IR and Raman both are useful for Fingerprinting.
Examples
1. Raman spectra of titania and zirconia
The Raman spectra of titania and zirconia sample is shown in Fig. 3.
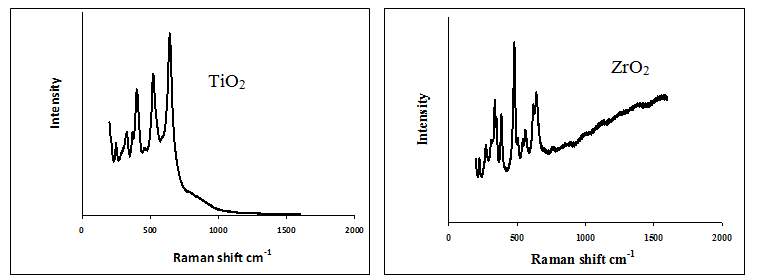
Fig. 3. Raman spectra for titania and zirconia
2. Study of surface vanadia species
The surface structure of supported vanadium oxide species can be studied using Raman spectroscopy. Different types of surface vanadium species are observed as shown in Fig. 4. Isolated V= O and polymeric V = O gives Raman band at 1026 cm-1 and 1009 cm-1 respectively.
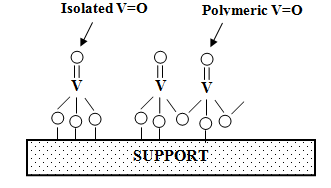
Fig. 4. Various surface vanadia species observed on supported vanadia catalysts
Book reference
• Colin N. Banwell & Elaine M. McCash, Fundamentals of molecular spectroscopy, Tata McGraw-Hill Pub. Co. Ltd., 2000.
• Ewen Smith & Geoffrey Dent, Modern Raman Spectroscopy – A Practical Approach, John Wiley & Sons Ltd. 2005
• Y. Leng, Materials Characterization: Introduction to microscopic and spectroscopic methods, John Wiley & Sons, 2008