When an endothermic process occurs (ΔH positive) in the sample, the temperature of sample (Ts) lags behind the temperature of reference (Tr). The temperature difference ΔT= (Ts-Tr) is recorded against reference temperature Tr and the corresponding plot is shown in Fig 12. In DTA, by convention, endothermic response is represented as negative that is by downward peaks. When an exothermic process (ΔH negative) occurs in the sample, the response will be in the reverse direction and the peaks are upward. Since the definition of ΔT =Ts-Tr is rather arbitrary, the DTA curves are usually marked with endo or exo direction.
It is essential that reference sample must not undergo any change in state over the temperature range used and both the thermal conductivity and heat capacity of reference must be similar to those of samples. Both sample and reference materials should be also inert towards sample holder or thermocouples. Alumina or silicon carbide are most commonly used standard reference samples. DTA profiles are affected by heating rate, sample size and thermocouple position within the sample.
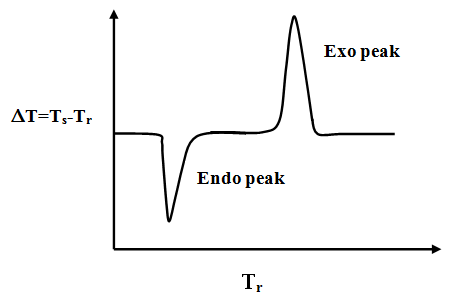
Fig. 10. Typical exo and endo peak in a DTA profile.
Application:
Any change associated with enthalpy change can be studied by DTA. In general DTA curves are used to get informations about temperature and enthalpy changes for decomposition, crystallization, melting, glass transition etc. In solid catalysis it is particularly useful to detect phase changes associated with calcination process. For example change of aluminum hydroxide to alumina can be easily detected by DTA.
Book References
• G. Ertl, H. Knozinger and J. Weitkamp, Handbook of Heterogeneous Catalysis , Vol. 2,WileyVCH, 1997.
• M.E.Brown , Introduction to thermal analysis : Techniques and application , second edition, Springer, 2007
• E.N. Kaufmann (Ed), Characterization of Materials, Wiley –Inter Science ,2003