The actual amount of hydrogen consumed is calculated from the area under the curve and the theoretical amount is calculated from stoichiometry of reduction equation. The average oxidation state of the solid material after reduction can be calculated thereafter.
4. Usually reducibility of the catalysts can be correlated to its activity if the mechanism involves redox reactions.
Examples
1. TPR of V2O5 catalysts
Amount of reducible species can be quantified by amount of H2 used by considering reduction stoichiometry as ![]()
The TPR profile of pure bulk vanadia is given in Fig. 2. The presence of multiple peaks is attributed to the multistep reduction sequence ![]()
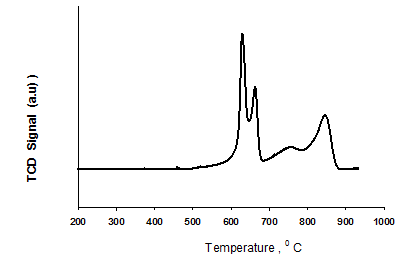
Fig. 2. Typical TPR profile of bulk vanadium oxide
2. TPR of supported nickel oxide catalysts
NiO is reduced in one step to metallic nickel according to following equation
![]()
(A) TPR of NiO/C catalysts is shown in Fig. 3. NiO is reduced in one step. Presence of single peak suggests NiO is present in one form.
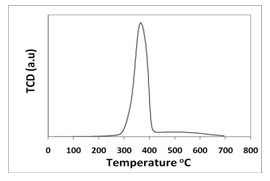
Fig. 3. Typical TPR profile of nickel oxide supported on carbon
(B) TPR of NiO supported on TiO2 catalysts is shown in Fig. 4. On titania the multiple reduction peaks are obtained for nickel oxide. The multiple peaks suggest presence of Ni species in various forms. The peak at the highest temperature corresponds to the Ni species most difficult to reduce which can be attributed to the higher interaction with support.
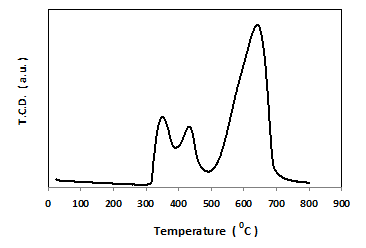
Fig. 4. Typical TPR profile of nickel oxide supported on titania