10. Actual pore volume evaporated, Vp. is then determined. Actual pore volume evaporated is composed of the volume evaporated out of the centre core plus the volume desorbed from the film left on the pore walls, For a pore of length L, ![]()
Now , ![]() By combining
By combining 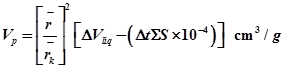
11. The surface area of the pores walls can be calculated from pore volume by:
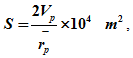 Vp in cm3/g and r in A0
An elaborate example of pore size distribution work table can be seen in Lowell et al. for more understanding.
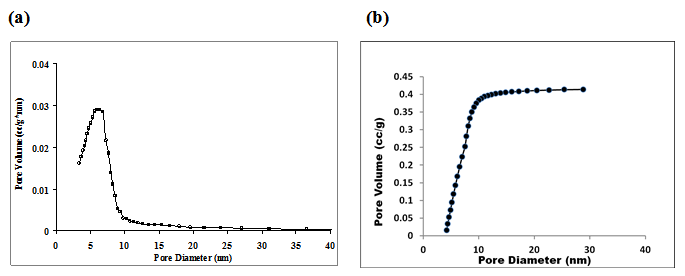
Fig. 4. Pore volume distribution of titania samples calcined at 4000C
(a) differential (b) cumulative
Pore size distribution can be represented both in differential and cumulative ways. The Fig. 4(a) shows the differential BJH pore distribution of titania sample calcined at 4000C. The figure shows that for the given sample pores were in the range of 2-10 nm. The corresponding cumulative pore distribution is shown in Fig. 4(b).
(b) By mercury intrusion
For macropores materials with pore diameter greater than 50 nm, the mercury intrusion method is preferred. Due to non-wetting nature of mercury on oxide supports, intrusion is met with resistance and mercury is forced to enter the pores of material under pressure. The pore radius ‘r' is related to the applied pressure P as
![]() ----------------------------(5)
----------------------------(5)
The wetting or contact θ angle between mercury and solid is on average lies in the range 130-1400 and surface tension of mercury is 0.48 N/m2. p is in atm and r in nanometers.
As can be observed from equation (5) smaller the pore radius higher is the pressure needed for mercury to intrude in the pore. At low pressure of 0-2 atm, mercury penetrates voids between particles. At moderate pressure range of 3-500 atm large macro pores are filled. At further higher pressure range of 500-2000 atm, smaller macro pores and large mesopores are progressively filled. This technique is satisfactory for pores down to 3-5 nm dia. Maximum diameter that can be measured is usually 105 nm. Mercury intrusion method is carried out in the instrument known as mercury porosimeter. In a typical mercury porosimeter data, volume of mercury penetrating into pores is plotted as a function of applied pressures.
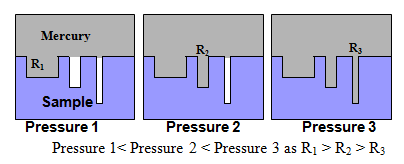
Fig. 5. Intrusion of mercury into pores of various sizes. Here ‘r' represents the radius of pores.
The pressure required for filling up the pores as a function of pore size is schematically shown in Fig.5. As pore radius decreases in the order r1> r2> r3, requried pressure for filling the pores increases in order of Pressure 1< Pressure 2 < Pressure 3. The available instruments can measure pore size up to 2 nm using a maximum operating pressure of about 400 MPa.
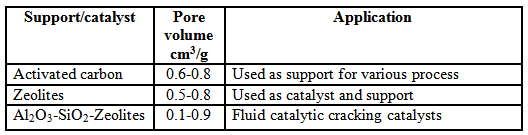
Table 1. Typical pore volume values of different support and catalyst.
Book reference
• S. Lowell, Joan E. Shields, Martin A. Thomas ,Characterization Of Porous Solids And Powders: Surface Area, Pore Size And Density - Springer, 2006
• J.J. Carberry , Chemical and catalytic reaction Engineering, Dover Publications, 2001
• J. M. Thomas & W. J. Thomas, Principles and Practice of Heterogeneous Catalysis, VCH, 1997
• Sam Zhang, Lin Li, Ashok Kumar, Materials Characterization Techniques, CRC Press, 2009