As is clear from figure 4.1, σ → σ* transition involves very high energy and usually lies in the vacuum UV region. Saturated hydrocarbons, that can undergo only σ → σ* transition, therefore show absorption bands at ~150 nm wavelength. Compounds that have unsaturation and/or lone pair of electrons i.e. the ones that can undergo π → π* or n → π* transitions, absorb at higher wavelengths that may lie in far or near UV regions, the regions of UV radiation the biochemical spectroscopists are usually interested in. The group of atoms in a molecule that comprise the orbitals involved in the transition is said to constitute a chromophore. Figure 4.2 shows an absorption spectrum of a peptide. The spectrum immediately suggests that the proteins can absorb both in near UV and far UV regions.
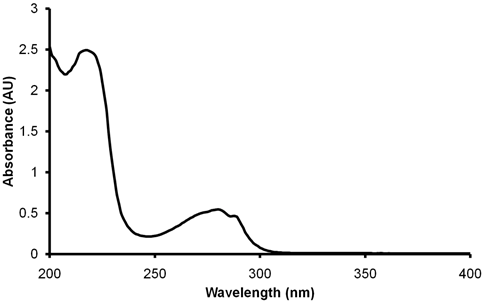
Figure 4.2 Absorption spectrum of a peptide in the near and far UV regions.
Absorption of UV radiation is usually represented in terms of absorbance and %transmittance:
(4.1) |
|
(4.2) |
where, I0 and I represent the intensities of light entering and exiting the sample, respectively.
Absorbance of an analyte depends on the concentration of the analyte and the path length of the solution (Beer-Lambert Law):
| A = εcl |
(4.3) |
where, ε is the molar absorption coefficient, c is the molar concentration of the analyte and l is the path length of the cell containing the analyte solution. If molar absorption coefficient of the analyte and the path length of sample cell are known, concentration can directly be determined using Beer-Lambert law.
Let us see how protein concentration is estimated using near and far UV radiation.