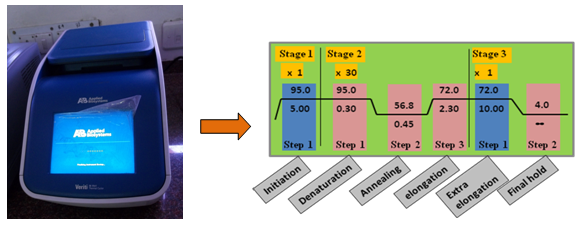
Figure 27.4. Representation of thermal cycler instrument showing the position of sample and schematic diagram of 30 cycle PCR.
Analysis of PCR results: Once PCR cycle is completed, the amplified product is loaded in the agarose gel and observed after ethidium bromide staining under UV light source (Figure 27.5). A water blank reaction is included to monitor the cross contaminating DNA source as template. The percentage of agarose gel depends on the size of DNA to be visualized. Generally 0.8-1% agarose gel is used for analyzing 0.5-5 kb amplified DNA while a DNA of larger size or genomic DNA is visualized in gel as low as 0.5%.
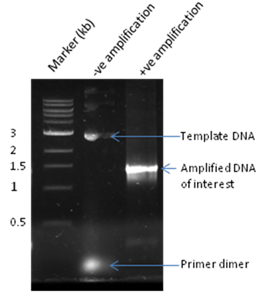
Figure 27.5: Analysis of PCR product on an agarose gel.