| |
Identifying the Type of Load |
 |
 |
If the load is inductive, point P lies in the upper half of the Smith chart. Then while moving clockwise on the
constant-VSWR circle, we first meet point T and then we meet poing S.
In other words, for inductive loads, voltage maximum is closer
to the load point than the voltage minimum.
Exactly opposite occurs for capacitive loads i.e., the voltage minimum
is closer to the load than the maximum. |
|
We can therefore quickly identify the load looking at the standing wave pattern. |
|
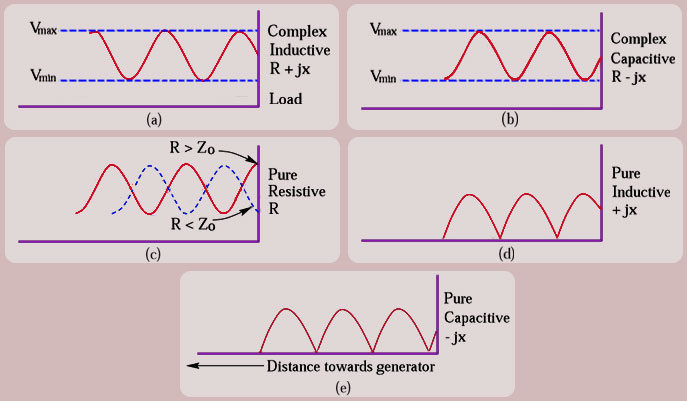
If the pattern is like the one given in
Figure (a), that is the voltage drops towards the load, the load is
inductive. |
 |
|
Similarly if the pattern is like that in Figure (b), that is, the voltage rises towards load, the load is
capacitive. |
|
|
If the voltage is maximum or minimum at the load, the load impedance is purely
resistive Figure (c). |
|
For the purely reactive loads the
point P will lie on the outermost circle making
 and and
 . .
The pattern for pure inductive loads will be
like that in Figure (d) and that for the pure capacative loads will be like
that in Figure (e). |
| |
|
 |
| |
Note |
| |
For identifying the load, observe two things on the standing wave pattern |
| (1) |
Minimum Voltage |
| (2) |
Location of Voltage minimum/maximum |
 |


