Thermogravimetric analysis:
• The plot of mass change in percentage versus temperature or time (known as TGA curves) is the typical result of TGA analysis as shown in Figure 23.02.
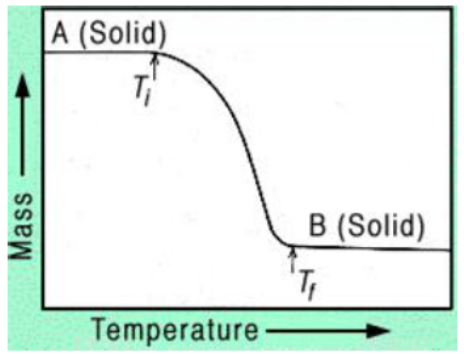
Figure 23.02: The plot of mass change with temperature.
• There are two temperatures in the reaction: Ti (starting of decomposition temperature) and Tf (final temperature) representing the lowest temperature at which the onset of a mass change is seen and the lowest temperature at which the process has been completed, respectively. The reaction temperature and interval (Tf - Ti) strongly depend on the conditions of the experiments. Hence, they can not have any fixed values.