Thermogravimetric analysis:
Examples of TGA curves:
Figure 23.06 displays three step weight loss of the synthesized hydrozincite. Step 1: ~ 4% weight loss in the temperature range of 30 - 250°C due to moisture, trapped carbon dioxide, and ammonia removal.
Step 2: ~ 10% weight loss around 250 - 325 °C due to the loss of three water molecules.
Step 3:16 % weight loss around 325 - 440°C, close to the loss of two CO2 molecules.
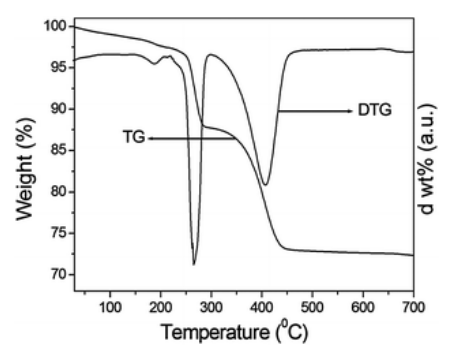
Figure 23.06: Weight loss in synthesized hydrozincite.
Ref.[3]. A. Sinhamahapatra et al, J. Mater. Chem., 2012, 22, 17227 [Copyright The Royal Society of Chemistry 2012].
Quiz 23:
(Q23.1) What are the different types of TGA? Which is commonly used in research labs?
(Q23.2) Describe different types of TGA curves?
(Q23.3) What are the processes, which cause weight loss in TG curves?
(Q23.4) Describe few applications of TGA?