4.8.3 Complete Picture of Frequency Dependence of the Dielectric Constant
So, now we can plot the contributions to the dielectric constant from all the mechanisms.
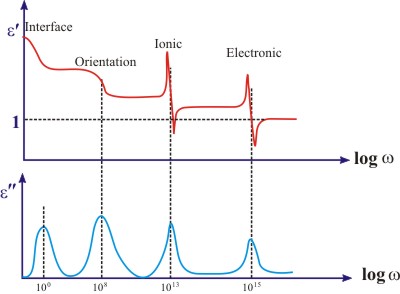
In case of an ideal dielectric material exhibiting all four basic mechanisms, we would expect the following curve.
| Figure 4.27 Complete plot of frequency dependence of dielectric constant and loss (note that frequency is not to scale) |
Although the above plot represents an ideal material, yet the plot gives an idea of what you might expect when you measure dielectric constant of a material as a function of frequency.
Although the real plots may look quite different (look for dielectric constant data for electronic ceramics in journal publications), you can expect a correlation between the real and imaginary part of the curve i.e. we can still clearly see the absorption peak.
As, mentioned earlier, for a non-magnetic dielectric solid, Maxwell’s electromagnetic equations predicts that εr be equal to n2.
|