Figure 4 presents the results of the
data analysis procedure of schlieren images for evaluation of the
temperature field and the Nusselt number distribution. Figure 4(a) shows the hue variation with respect
to the non-dimensional height  at cavity widths of at cavity widths of  The hue variation is large
near the walls The hue variation is large
near the walls  representing the lower wall region and representing the lower wall region and  for the top wall
region). Hue is nearly constant in the central region i.e. for the range y/H = 0.2 to 0.8. Figure 4(b) shows
the temperature gradient variation obtained using the calibration curve and Equation 3. The integration
of the temperature gradient of Figure 4(b) along with the known wall temperatures leads to the
temperature distribution shown in Figure 4(c). The temperature profiles show a steep variation in the
near wall region and almost a zero slope at the centre of the cavity. The temperature gradient in the near
wall region from Figure 4(c) is used in Equation 7 leading to the spanwise Nusselt number distribution
in Figure 4(d). The central region of the lower wall shows a nearly constant Nusselt number, which
decreases towards the corners of the cavity. This reduction in the Nusselt number is related to a zero
heat flux at the side walls arising from the insulated boundary condition. for the top wall
region). Hue is nearly constant in the central region i.e. for the range y/H = 0.2 to 0.8. Figure 4(b) shows
the temperature gradient variation obtained using the calibration curve and Equation 3. The integration
of the temperature gradient of Figure 4(b) along with the known wall temperatures leads to the
temperature distribution shown in Figure 4(c). The temperature profiles show a steep variation in the
near wall region and almost a zero slope at the centre of the cavity. The temperature gradient in the near
wall region from Figure 4(c) is used in Equation 7 leading to the spanwise Nusselt number distribution
in Figure 4(d). The central region of the lower wall shows a nearly constant Nusselt number, which
decreases towards the corners of the cavity. This reduction in the Nusselt number is related to a zero
heat flux at the side walls arising from the insulated boundary condition.
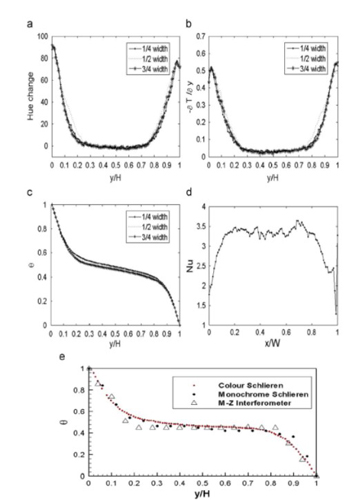
Figure 4: The steps involved during the quantitative analysis of color schlieren; (a) change in hue, (b) temperature gradient, (c) non-dimensional temperature and (d) Nusselt number. The non-dimensional temperature from the present experiment is compared with previous work in (e)
|