The validation of the reconstruction procedure with simulated data is summarized in Figure 5.18.
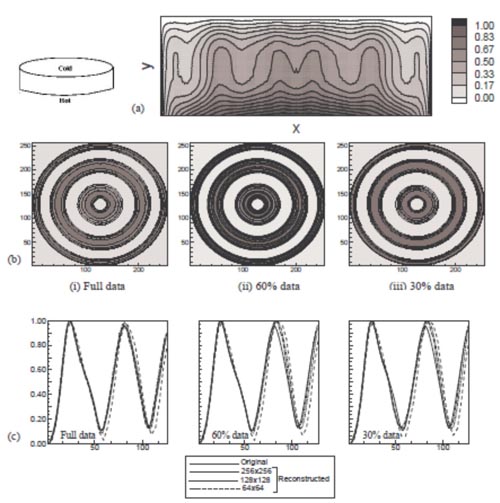
Figure 5.18: Buoyancy-driven convection in a differentially heated circular cavity. (a) Complete projection data in the form of isotherms for the differentially heated circular fluid layer; (b) Reconstructed temperature contours at y/H=0.65 for full (i) 100% and partial (60% (ii), 30% (iii)) projection data; and (c) Comparision of original and reconstructed non-dimensional temperature distribution along the radial direction for the three different combinations of rays and views.
Figure 5.18(a) shows isotherms of the thermal field in the fluid layer for a given view angle. This data is presented in the form of contours of the path integrated temperature field. Since the thermal field is axisymmetric, the projection data for all other view angles are identical to Figure 5.18(a). The reconstruction over a horizontal plane of the fluid layer is shown in Figure 5.18(b).
|