| |
Figure 4.48 shows a collection of original interferograms at a Rayleigh number of 1.39x10⁴ for a view angle of  . The roll formation, specifically five complete and two partial rolls are clearly seen here. For the cavity size studied, the number of rolls is in the range of 14-16. For compactness, thinned interferograms alone have been presented in this work. Figure 4.49 shows isotherms within the cavity for four different view angles at Ra=1.39x10⁴. As discussed earlier, the isotherms completely correspond to the fringe skeleton of the . The roll formation, specifically five complete and two partial rolls are clearly seen here. For the cavity size studied, the number of rolls is in the range of 14-16. For compactness, thinned interferograms alone have been presented in this work. Figure 4.49 shows isotherms within the cavity for four different view angles at Ra=1.39x10⁴. As discussed earlier, the isotherms completely correspond to the fringe skeleton of the  projections. At other view angles, the corrospondence between fringes and isotherms is lost owing to changes in the path length traversed within the fluid layer, this is not a source of error since the geometric factor can be analytically accounted for. In the present work, the fringes have been mapped to temperatures over a grid and isotherms extracted from this data. Thus, thinned images for other view angles in figure 4.49 shows isotherms, determined from the interpolated grid values. Figure 4.40 shows thinned images of the fluid layer for a Rayleigh number of 4.02 x 10⁴ at view angles of . projections. At other view angles, the corrospondence between fringes and isotherms is lost owing to changes in the path length traversed within the fluid layer, this is not a source of error since the geometric factor can be analytically accounted for. In the present work, the fringes have been mapped to temperatures over a grid and isotherms extracted from this data. Thus, thinned images for other view angles in figure 4.49 shows isotherms, determined from the interpolated grid values. Figure 4.40 shows thinned images of the fluid layer for a Rayleigh number of 4.02 x 10⁴ at view angles of .
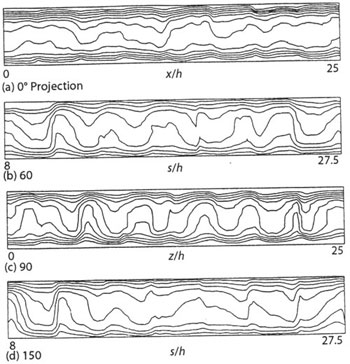
Figure 4.48: Thinned images of the cavity Ra=1.39x10⁴, 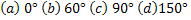 projections. projections.
The correctness of fringe thinning, assigning fringe temperatures, and a check on the magnitude of interpolation errors have been examined by using the following result: at steady state, the width-average of the line integrals of temperature field ploted as a function of the vertical coordinate is independent of the projection angle. This is because the total energy transferred across the cavity is unchanged from one horizontal plane to the next.
Figure 4.49: Thineed image of the cavity, Ra=4.02 x 10⁴, (a)  , (b) , (b)
|