Figure 4.50 shows the variation of line integrals of the temperature field averaged over a horizontal plane as function of the vertical coordinate measured form the cooled top wall for both  projections at Rayleigh number of 1.39x10⁴. The corresponding graph for Ra=4.02 x 10⁴ is shown in Figure 4.51. The S-shaped curve, characteristic of buoyancy-driven convection can be seen here. The curves for the two projections match closely and their slopes at the hot and cold walls are practically equal. The S-shaped curve for the angular projection have not been shown since the corresponding projection data have been subsequently corrected to ensure that between the two projections, the S-shaped curve is strictly unique. This step did not alter the isotherms in Figures 4.50 and 4.51 to any significant degree, but was expected to improve convergence of the tomographic inversion process. projections at Rayleigh number of 1.39x10⁴. The corresponding graph for Ra=4.02 x 10⁴ is shown in Figure 4.51. The S-shaped curve, characteristic of buoyancy-driven convection can be seen here. The curves for the two projections match closely and their slopes at the hot and cold walls are practically equal. The S-shaped curve for the angular projection have not been shown since the corresponding projection data have been subsequently corrected to ensure that between the two projections, the S-shaped curve is strictly unique. This step did not alter the isotherms in Figures 4.50 and 4.51 to any significant degree, but was expected to improve convergence of the tomographic inversion process.
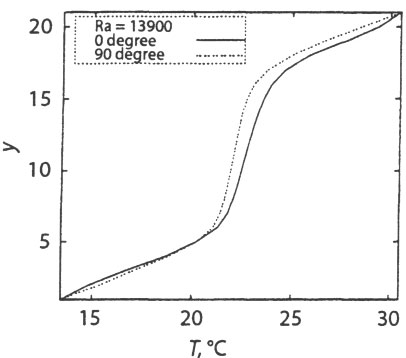
Figure 4.50: Width averaged temperature profile in the cavity, Ra=1.39x10⁴ (y=1 is the top wall.)
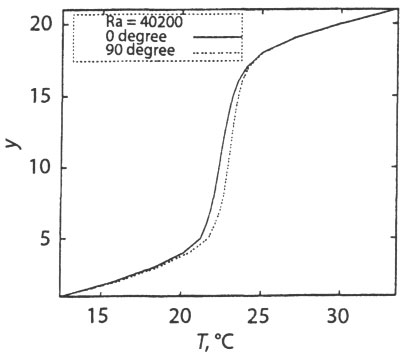
Figure 4.51: Width averaged temerature profiel in the cavity, Ra=4.02 x 10⁴ (y=1 is is the top wall.)
|