Uncertainty and Measurement Errors
Errors in the experimental data are associated with misalignment of the apparatus with respect to the light beam, image processing operations including filtering, thinning and assigning temperature to fringes, error amplification during three-dimensional reconstruction, and the intrinsic uncertainly in the convection process itself. Errors related to refraction effects have been found to be quite small. All experiments were conducted several tomes to establish the repeatability of the fringe patterns. Time-dependent movement of fringes was not a source of uncertainly in the present work at a Rayleigh number of 1.39x10⁴. However, at a Rayleigh number of 4.02 x 10⁴, two sets of convection patterns were seen to be formed. Analysis has been carried out for the fringes patterns that formed for the most part of the experiment. The associated uncertainly in the local Nusselt number was found to be  with 95% confidence. At both Rayleigh numbers, the plate-averaged Nusslet number was found to be in good agreement with published correlations and is discussed in Section Result and Discussion.The width-averaged temperature profile that represents energy balance across the cavity was also found to be unique and well-defined. Hence, the result obtained in the present work can be taken to be qualitatively meaningful. with 95% confidence. At both Rayleigh numbers, the plate-averaged Nusslet number was found to be in good agreement with published correlations and is discussed in Section Result and Discussion.The width-averaged temperature profile that represents energy balance across the cavity was also found to be unique and well-defined. Hence, the result obtained in the present work can be taken to be qualitatively meaningful.
Image Processing and Data Reduction
The three-dimensional reconstruction of the temperature field requires a noise-free set of projection data as input. Hence, prior to the calculation of the projection data in terms of the temperature, interferometric images have to be cleaned.
The projection data of the temperature field in the fluid layer is available at this stage in the form of temperatures at locations defined by the fringe geometry. To apply a tomographic algorithm, the projection data is required over a uniform grid. In the present study, two-dimensional quadratic Interpolation has been employed to transfer projection data from the fringe patterns to a uniform grid. The cavity height was discretized into 21 horizontal planes. The number of vertical columns at which interpolation was carried out for the  projections was 120. For the angular interpolations, the cavity width was effectively larger. However, the extreme ends of the cavity could not be due to reduction in the path length of the light beam trsversing the fluid layer. At these locations, there was a drastic reduction int he number of fringes and corresponding increase in the fringe spacing. Hence, for angular projections, only 160 vertical columns covering 60% of the cavity width were considered. The error introduced in the projection data dur to interpolation was found to be less than 0.01%. projections was 120. For the angular interpolations, the cavity width was effectively larger. However, the extreme ends of the cavity could not be due to reduction in the path length of the light beam trsversing the fluid layer. At these locations, there was a drastic reduction int he number of fringes and corresponding increase in the fringe spacing. Hence, for angular projections, only 160 vertical columns covering 60% of the cavity width were considered. The error introduced in the projection data dur to interpolation was found to be less than 0.01%.
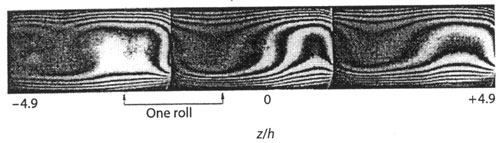
Figure 4.47: Original interferograms showing 5 full and 2 partial rolls at Ra=1.39x10⁴,  projection. projection.
more...
|