Once the correlation is found, the Fourier transformations are converted back into
the physical space. The displacement that yields a maximum in the correlation function
over the interrogation area is regarded as the particle displacement. Actually it is not
the particle displacement which is computed but the displacement of the interrogation
area. The displacement vector is of �first order, i.e. the average shift of the particles
is geometrically linear within the interrogation window. The size of the interrogation
should be suffciently small such that the second order effect, i.e. displacement gradients
can be neglected.
Peak detection and displacement estimation
One of the important steps in evaluation of PIV images is to measure the position of correlation
peak accurately to sub-pixel accuracy. To increase the accuracy in determining
the location of the displacement peak from pixel to sub-pixel accuracy, an analytical
function is fitted to the highest correlation peak by using the adjacent correlation
values. Various methods of estimating the location of the correlation peak have been
proposed. Some of these are peak centroid fit, Gaussian peak fit and the parabolic peak fit. Of the three, the Gaussian fit is most frequently used to estimate the shape of the signal
around its peak assuming ideal imaging conditions. This function is pixel to sub-pixel accuracy, an analytical
function is fitted to the highest correlation peak by using the adjacent correlation
values. Various methods of estimating the location of the correlation peak have been
proposed. Some of these are peak centroid fit, Gaussian peak fit and the parabolic peak fit. Of the three, the Gaussian fit is most frequently used to estimate the shape of the signal
around its peak assuming ideal imaging conditions. This function is
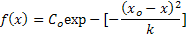
where  indicates the exact location of the maximum peak and indicates the exact location of the maximum peak and  and k are parametric coeffcients. Using this expression for the main and the adjacent correlation values and
the fact that the first derivative of this expression at must be zero, the position can be estimated with sub-pixel accuracy. Generally, a 3-point Gaussian peak fit gives good
results. When the particle image size is small, the displacement tends to bias towards
integer values. The assumed peak shape does not match the actual shape of the peak and
the three point Gaussian estimator cannot represent the true shape of the correlation
function. This is called the peak-locking effect. In actual displacement data, the presence
of the peak-locking effect can be detected from histogram plot. and k are parametric coeffcients. Using this expression for the main and the adjacent correlation values and
the fact that the first derivative of this expression at must be zero, the position can be estimated with sub-pixel accuracy. Generally, a 3-point Gaussian peak fit gives good
results. When the particle image size is small, the displacement tends to bias towards
integer values. The assumed peak shape does not match the actual shape of the peak and
the three point Gaussian estimator cannot represent the true shape of the correlation
function. This is called the peak-locking effect. In actual displacement data, the presence
of the peak-locking effect can be detected from histogram plot.
|