39.1 Introduction
Flow visualization is carried out to understand the physics of the flow in detail. Understanding of the flow provides excellent description which in turn helps to calculate flow properties for many problems of practical interests in both compressible subsonic and supersonic flow regimes. Flow visualization can be of interest for various problems. Since air is transparent, thus their flow patterns are invisible to us without incorporating special techniques to visualise the same. Therefore the present section deals with some important flow visualisation techniques.
39.2 Interferometer
The interferometer which is an optical method is specifically suited for qualitative determination of the density field of high speed flows. From the theory of light, we know that when light travels through a gas the velocity of propagation is affected by the physical properties of the gas. Principle of working of the interferometer is based on this fact.
Figure 39.1 shows the essential features of the Mach-Zhender Interferometer. Light emitted from the source is allowed to pass through the lens L1 which makes the light rays parallel with each other. These parallel light beams are then passed through a monochromatic filter. The path of the light wave is then made by two ways as M1-M2-M4 and M1-M3-M4 in the way to fall on the screen as shown in Fig. 39.1. Here M represents mirror shown in same figure. These two paths are possible due to half silvered mirror M1 which divids a light beam into two beams. These two beams travel same distance in their respective paths before recombining at lens L2 and getting projected on the screen. Although the length of travel for both the beams is same, however the medium of travel is necessarily differerent since one beam which travels via M1-M3-M4 path actually enounters room air where as the other beam travelling through M1-M2-M4 passes through the test section. For the situation without any flow through the test section, both the rays face similar medium and fall on the screen as a single ray after combining. Thus a screen gets illuminated by a uniform patch of light. However, the situation changes with in the presence of flow in the test section where density change is encountered by one ray in the presence of shock. This increased density retards the beam passing through the test section and hence creates phase difference between the two beams. If this phase difference is λ/2 where λ is wave length, then two rays mark contrast spots on the screen. Therefore, we can observe dark and white bands on the screen for appreciable difference in the density.
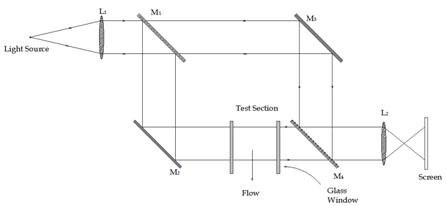
Fig 39.1 Mach-Zhender Interferometer.