21.2 Applications of P-θ diagram
Pressure-deflection diagram is very useful for understanding various flow features like shock-shock interaction, shock reflection etc. Therefore the main objective of working with this diagram is to understand the deflection of flow which encounters various shocks. Consider a supersonic flow experiencing two left running shock waves shown in Fig. 21.3. Corresponding P-θ is shown in Fig. 21.4.
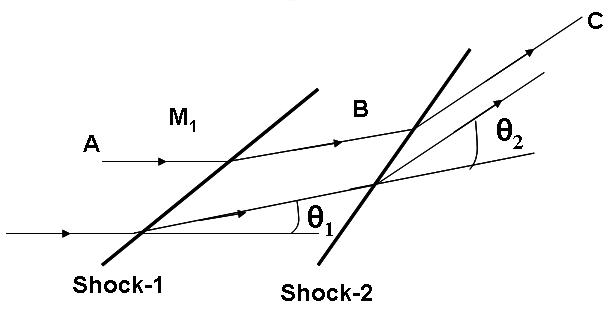
Fig. 21.3 Supersonic flow passing through two left running shock waves
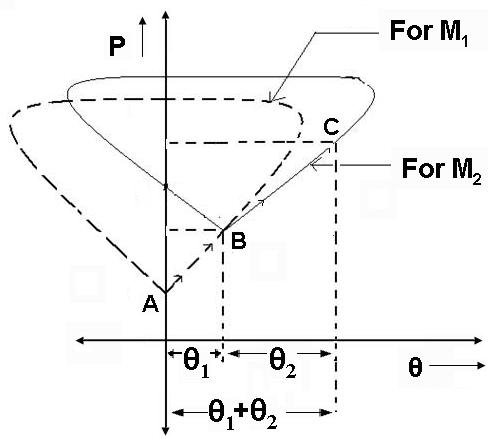
Fig. 21.4 P-θ diagram for the supersonic flow passing through two left running shock waves
Here we can clearly understand the usefullness of this diagram. Consider a streamline ABC in this flowfield. The initial or pre shock conditions are given point A on P-axis which corresponds to zero deflection. After passing through the first shock, the flow gets deflected by an angle θ1 which is represented by point B. We have to follow the P-θ diagram starting from point A, corresponding to its freestream conditions, to get the point B. The point B clearly portrays increase in pressure and positive deflection of the flow in the presence of left running shock wave. Further experience of next shock brings in the change in flow properties which are represented by point C. We have to draw a new P-θ diagram at point B, corresponing to its freestram conditions, to arrive at point C. For this fact, deflection of the flow at point B would be treated as zero and relative displacement between point B and C (θ2) should be plotted to get the point C. However state of the point C given in this diagram gives total flow deflection and final pressure.
Consider a supersonic flow experiencing a left running shock wave followed by a right running shock wave shown in Fig. 21.5. Corresponding P-θ is shown in Fig. 21.6. Consider a streamline XYZ in this flowfield.
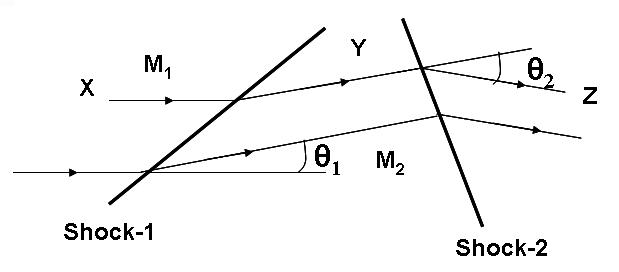
Fig. 21.5 Supersonic flow passing through throgh left and right running shock waves respectively
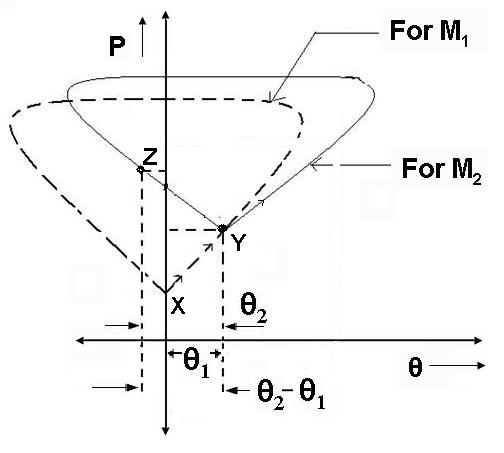
Fig. 21.5 P-θ diagram for the supersonic flow passing through throgh left and right running shock waves respectively
The initial or pre shock conditions are given point X on P-axis which corresponds to zero deflection. After passing through the first shock which is left running shock, the flow gets deflected by an angle θ1 which is represented by point Y. Here as well, we have to follow the P-θ diagram starting from point A, corresponding to its freestream conditions, to get the point Y. The point Y clearly portrays increase in pressure and positive deflection of the flow in the presence of left running shock wave. Further experience of right running shock wave brings in the change in flow properties which are represented by point Z. We have to draw a new P-θ diagram at point Y, corresponing to its freestram conditions, to arrive at point Z. For this fact, deflection of the flow at point Y would be treated as zero and relative displacement between point Y and Z (θ2) should be plotted to get the point Z. Since the flow is facing right running shock wave, the deflection θ2 is negative in reference with the origin at Y. However presence of the shock increases pressure of the flow. Therefore, state of the point Z given in this diagram gives total flow deflection and final pressure.