21.1 P-θ diagram
Pressure-deflection diagram is one more tool to present the oblique shock solution. This diagram necessarily plots various possible pressures for change in flow deflection angle for a given Mach number. Hence we can plot this, P-θ diagram, for all the Mach numbers to evaluate the range of pressure for a given Mach number and the same for given deflection angle. This diagram also provides the shock detachment angle. Typical P-θ diagram for a known Mach number is shown shown in Fig. 21.1. All the points marked on this diagram have some special feature associated with them.
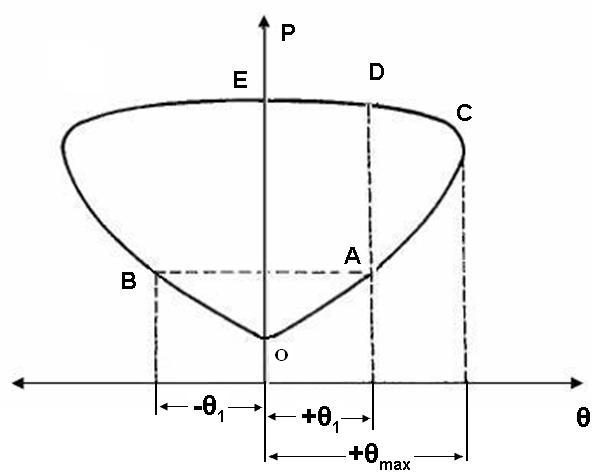
Fig. 21.1. Typical Pressure deflection diagram for a known Mach number
Here point O represents the pre-shock conditions and corresponds to the conditions at zero degree flow deflection. The main feature of the figure is the terminology used while constructing it. Here deflection of the flow by left running shock is treated as positive while deflection of the flow by right runnning shock wave is considered as negative. The typical left and right running shock waves are shown in Fig. 21.2.
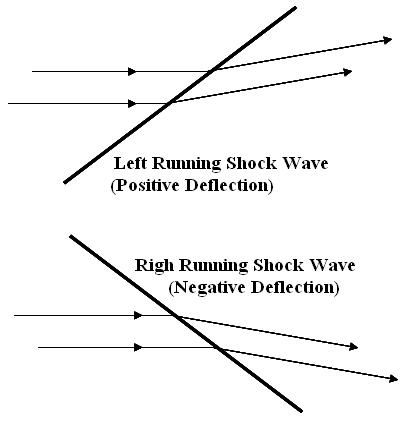
Fig. 21.2. Typical left and right running shock waves
The shock wave is termed as a left running shock wave where we can feel the shock wave to be passing on left side of the observer who is standing on the shock wave with downstream attention. Simillarly shock wave is termed as a right running shock wave where we can feel the shock wave to be passing on right side of the observer who is standing on the shock wave with downstream attention. Therfore, the points A and B of the Fig. 21.1 represent same post shock pressure for the same pre shock conditions but for two different deflections viz. positive θ and negative θ respectively. Typical shock patterns represnetd by these two points can be visualised using Fig 21.2. Point C on this P-θ curve represents the maximum possible θ or flow deflection angle. Point D represents higher pressure for the same θ for a given Mach number as that represented by A. Therefore, it becomes clear to us that point A is the weak shock solution while point D is the strong shock solution sincre pressure corresponding to point D is more than that of A. In the same diagram, point E represents zero deflection and highest pressure which corresponds to the normal shock situation which leads to no delfection with maximum pressure rise for the given Mach number.