13.3 Effect of Change in Mass Flow Rate on T-S diagram for Rayleigh flow

Fig 13.3 A proposed experimental set up for 1D heat addition studies.
The h-s plot shown for heat addition process in Fig. 12.2 belongs to a perticular value of mass flow rate. If we change the mass flow rate then the curve changes. Hence we need to find out the new curve in case of decreased or increased mass flow rate conditions. Consider the proposed experimental set up shown in Fig. 13.3 for the Rayleigh flow studies. Here we can change the mass flow rate by changing the reservior conditions (pressure and temperature) and also the exit pressure. During the experiment, gas stored in the reservoir expands through the nozzle and achieves certain mass flow rate while flowing through the constant area duct where heat addition takes place. We are going to learn the topic "flow through nozzle" in detail in the comming lectures, however for now, we can assume that, mass flow rate for subsonic flow can be increased by decreasing the exit pressure or increaseing the reservoir pressure. Simillarly, we can increase the mass flow rate of supersonic flow by increase in recervior pressure or by decreasing the reservoir temperature.
Consider the case of subsonic flow with increased mass flow rate. Initial isentropic expansion in the nozzle is given by the vertical line joining reservoir conditions and point 1 in Fig. 13.4. If we add heat in the flow through constant area duct then the process of heata addition is represented by the dotted curve in the same figure. Suppose we increase the mass flow rate by decreaseing exit pressure, then static enthalpy or static temperature at the entry to the heating duct decreases. Hence length of the initial vertical line increases and the nozzle exit conditions for subsonic flow are represented by 1'.
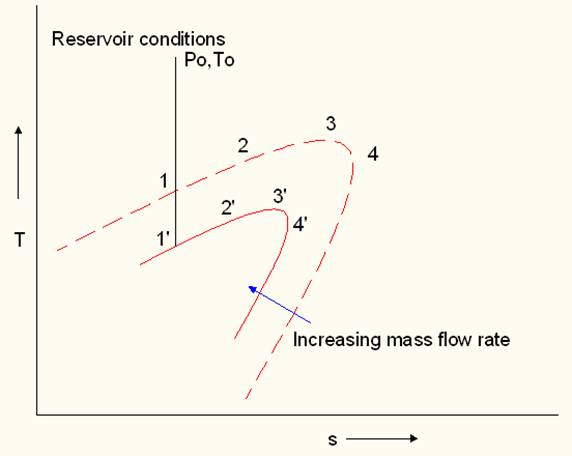
13.4 Rayleigh for increase in mass flow rate conditions
Further process of heat addition is shown by the thick line in the Fig. 13.4. Hence increase in mass flow rate of subsonic flow shifts the Rayleigh curve downwards. Now consider the prcoess of heat addition in supersonic flow. We will have to replace the nozzle connecting the reservior and heat addition section in Fig. 13.3 by corresponding supersonic nozzle to attain required supersonic Mach number at the entry to the constant cross-section heat addition section. Dotted Rayleigh curve given in Fig. 13.4 represents the process of heat addition in the inital mass flow rate of supersonic fow. Increase in this mass flow rate can be achieved by increaseing the reservoir pressure which is necessarily the total pressure of the flow. Since we have to increase the total pressure to increase the mass flow rate of supersonic fow, the static pressure, enthalpy and hence temperature increase at the entry to the heating duct. Further process of heat addition is given by the thick line in Fig. 13.4. Hence increase in mass flow rate of supersonic flow shifts the Rayleigh curve upwards.
Two Rayleigh curves drawn for two mass flow rates can not cut each other since, in such a case, the point of itersection of two curves will represent two differnt values of a thermodynamic property like density which is impossible. Therefore complete shrinking of the Rayleigh curve is necessary to represent the increased mass flow rate. This proves that maximum entropy attained by addtion of heat decreases with increase in mass flow rate.
This understanding helps in accessing the situation where addition of heat is more than the required to reach sonic state for subsonic or supersonic flow. In both the situations, upstream mass flow rate at the heat addition station decreases. Hence enering subsonic flow at the heating station becomes lower subsonic or entring supersonic flow becomes subsonic in the presence of a shock to accomodate the extra heat.