13. 1 Choking of the flow with Heat Addition
It had been observed that the point of maximum entropy or maximum total temperature represents sonic condition. This condition also represents the maximum possible heat addition in a flow. However further increase in amount of heat addition in the flow decreases the mass flow rate through change in upstream or inlet conditions. Expected streamline pattern for un-choked and choked flow is shown in Fig. 13.1 and Fig. 13.2 respectively.
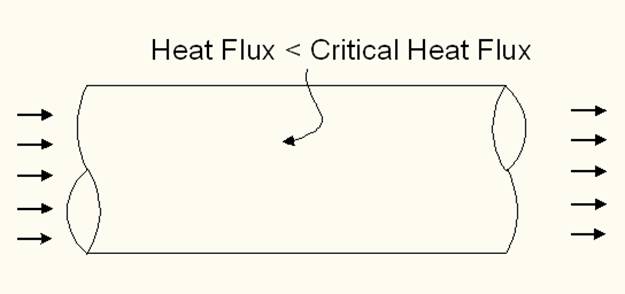
Fig. 13.1 Streamline pattern for unchocked condition.
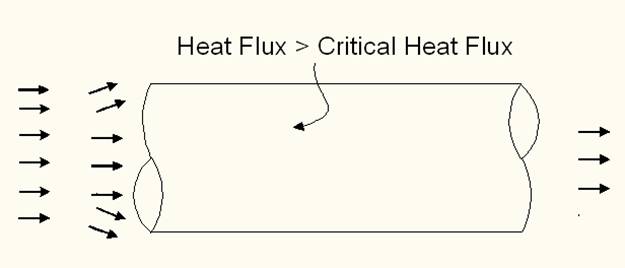
Fig. 13.2 Streamline pattern for chocked condition.
13.2 Total Property Line of Rayleigh Curve
Total enthalpy and entrpoy for 1D flow with heat addition has also been poltted in Fig.12.2. Slope of this total total enthalpy curve can be obtained from the above equation as,
![]()
Value of the local temperature on h0-s diagram gives the slope of the curve. The Fig 12.2 has been plotted for the single value of mass flow rate and we have already proved that upper branch of h-s diagram of Rayleigh line corresponds to subsonic flow. Hence bottom brach showing monotonic h-s curve for lower static enthalpy at the same mass flow rate corresponds to supersonic flow. Since subsonic flow has lesser kinetic energy, it has higher static enthalpy in turn higher static temperature in comparison with the supersonic flow for the same mass flow rate. Hence total enthalpy line for supersonic flow has lower slope than subsonic flow total enthalpy line. However both the lines should meet at highest total enthalpy point or highest entropy or sonic point for this mass flux condition. Hence, supersonic flow total enthalpy line should be at the top of subsonic total enthalpy line which is unlike the static enthalpy entropy lines. This fact can also be interpreted from the definition of total enthalpy where velocity appears in square. Since, mass flow rate is same and velocity of supersonic flow is higher than the velocity of subsonic flow, total enthalpy of supersonic flow will be higher than that of subsonic flow. Both static and total enthalpy lines cut the constant pressure lines on the corresponding charts which represent static and total pressures respectively. We can clearly see from Fig. 12.2 that static pressure increases due to heat addition in supersonic flow and the same decreases for subsonic flow. It is also clear from this figure that total pressure decreases for both supersonic and subsonic flows due to heat addition.
Understnding of process of heat addition in supersonic flow is much simpler than that for subsonic flow. It is also evident from the h-s diagram (12.2) which represents monotonic curve for supersonic flow. It is clearly evident from this figure that static enthalpy, entropy and pressure increase due to heat addition for supersonic flow. From equation of Rayleigh curve for p-v chart, we can also know that increase in pressure leads to decrease in specific volume and hence increase in density for supersonic flow with heat addition. Highest amount of heat addition in the given supersonic flow leads to choking, maximum entropy and maximum temperature. Therefore point 4 represents the choking of supersonic flow as it represented for the subsonic flow of same mass flow rate. It can be clearly concluded that the process of heat addition can lead to supersonic flow to sonic state and further heat rejection to lower subsonic state. Moreover, heat addition in subsonic flow can fetch the sonic conditions and further heat rejection leads to supersonic condition. Hence possibility of reversible heat interaction eventually leads to trace the complete h-s plot of Rayleight curve for a given mass flow rate.