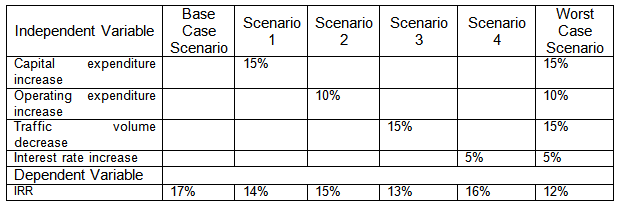
The application of sensitivity analysis for risk analysis is demonstrated with a hypothetical example of a BOT road project. The outcome of the project such as internal rate of return which is the dependent variable is calculated using the most likely forecasts of the project independent variables such as capital expenditures, operating expenditures, forecast traffic volume, interest rate, and inflation rate. This is called the base case scenario. Impact of a risk on the project outcome is determined by changing the value of the independent variable. For instance, the impact of increase in operating expenditure, say by 10% from the base case scenario value, on the project IRR is reduction in IRR from the base case scenario IRR value of 17% to 15%. Similarly, the impacts on the project IRR due to adverse changes of the other independent variables is shown in Table 3. When all the changes shown in Table 3 are superimposed, the scenario obtained by combining all the changes is known as the worst case scenario.
Table: 3 Results of the Sensitivity Analysis for Adverse Changes in Independent Variable Values
Similarly for the best case scenario, Table 4 shows the impact on the project IRR due to beneficial changes in the values of the independent variables.
Table: 4 Results of the Sensitivity Analysis for Beneficial Changes in Independent Variable Values
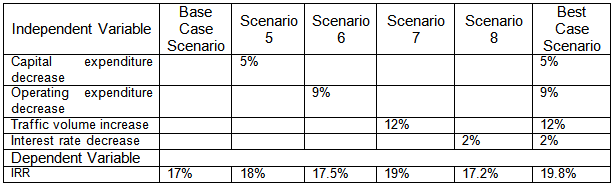
The difference in IRR values between worst case and best case scenarios is 7.8%, which is the range within which the project's IRR is expected to vary once the project is implemented. Based on the impact of the changes in independent variable on the project's IRR it is also possible to find out which risk has the greatest impact on the project.
In Probability Risk Analysis , the impacts of the risks are determined by modeling the outcomes of an event using the simulation technique Monte Carlo simulation technique. In this technique, the consequences of a risk event is computed many times with the input values randomised from a probability distribution function chosen for each iteration from the probability distributions of each variable. The commonly used probability distribution functions include normal distribution, triangular distribution, and uniform distribution. Uniform distribution is normally used if there is no obvious value that is more likely than any other between specified high and low bounds.